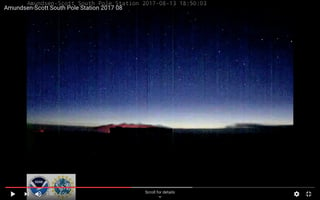
tl;dr: You are seeing Astronomical twilight growing brighter through the month of August 2017 at the south pole!
For more on the Moon's motion see the excellent answer to How does the Moon move in the "night" sky as seen from the poles?
Here are two screenshots and a calculation of the altitude and azimuth of the Moon and the Sun throughout the month of August 2017 from the Amundsen-Scott South Pole Station.
The solid blueish line is for the Moon, the dashed orangish line is for the Sun. You can see that while the Moon dips below the horizon for the middle third of the month, the Sun is always below the horizon. However twilight is approaching and the Sun is only about 10 degrees below the horizon near the end of the month.
Astronomical dawn begins when the Sun at 18 degrees below the horizon and the Sun is above -18 degrees for the entire month!
Also note that while the Sun and Moon spend much of the month at very different azimuth positions, opposite each other around the 8th and nearly the same azimuth around the 22nd.
I've also taken two screen shots and calculated the positions of the Moon and Sun at their timestamps. It looks like the camera is pointed at an azimuth of about 250 degrees, the Moon is clearly above the horizon at the beginning of the month and a nice twilight glow from 14.4 degrees below the horizon reveals the Sun's position.


                 left                              right
            ------------------------        ------------------------
object           The Moon                           The Sun
UTC ISO     2017-08-02T02:34:56Z            2017-08-13T18:50:03Z
alt(elev)   <Angle 15deg 34' 47.4">         <Angle -14deg 25' 57.5">
azimuth     <Angle 256deg 39' 49.6">        <Angle 258deg 40' 32.9">
distance    <Distance 0.00269439 au>        <Distance 1.01304 au>
Here is the Python script used for this information, which is based on the excellent Skyfield package.
from skyfield.api import Loader, Topos
import numpy as np
import matplotlib.pyplot as plt
from skyfield.api import load

halfpi, pi, twopi = [f*np.pi for f in (0.5, 1, 2)]
to_degs, to_rads = 180/pi, pi/180

load = Loader('~/Documents/fishing/SkyData')  # avoids multiple copies of large files
ts = load.timescale() # include builtin=True if you want to use older files (you may miss some leap-seconds)
eph = load('de421.bsp')

earth, sun, moon = [eph[x] for x in ('earth', 'sun', 'moon')]
AS = earth + Topos('90.0 S', '0.0 E', elevation_m = 2835)

hours = np.arange(24*31)
days = hours/24 + 1
times = ts.utc(2017, 8, 1, hours)

malt, maz = [thing.radians for thing in AS.at(times).observe(moon).apparent().altaz()[:2]]
salt, saz = [thing.radians for thing in AS.at(times).observe(sun).apparent().altaz()[:2]]

plt.figure()
plt.subplot(2, 1, 1)
plt.plot(days, to_degs * malt, '-')
plt.plot(days, to_degs * salt, '--')
plt.plot(days, np.full_like(days, fill_value=-18.),
         '-k', linewidth=0.5) # twilight
plt.xlim(1, 31.98)
plt.ylabel('altitude (deg)')
plt.subplot(2, 1, 2)
plt.plot(days, to_degs * maz, '-')
plt.plot(days, to_degs * saz, '--')
plt.xlim(1, 31.98)
plt.ylabel('azimuth (deg)')
plt.xlabel('days')
plt.suptitle('Moon from Amundsen-Scott August 2017')
plt.show()

t1, t2 = ts.utc(2017, 8, 2, 2, 34, 56), ts.utc(2017, 8, 13, 18, 50, 3)

print(t1.utc_iso(), AS.at(t1).observe(moon).apparent().altaz())
print(t2.utc_iso(), AS.at(t2).observe(sun).apparent().altaz())


