9
$\begingroup$

I would like to know in what year precisely did Earth's aphelion coincide (within 24 hours) with the northern winter (December) solstice? From what I understand, the day (on any tropical calendar) on which Earth is at aphelion in its orbit changes over time due to axial precession. Is there a reference like an almanac where this is calculated? If not, how do we calculate this ourselves and how precise and accurate can we be?

Edit 1: I just read that maybe the calculation is more complicated because of apsidal precession but I don't really understand now...

Edit 2: My guess is that the date I'm seeking was roughly 13-14 thousand years ago since northern winter solstice was at perihelion in 1246 AD and the period of axial precession is roughly 26 thousand years (so, something kind of like (1246 AD) - (25,772/2 years) = 11641 BC. Wolfram Alpha says this is wrong though because the winter solstice would have been December 14th while the aphelion would have been November 9th. That would be quite a bit off.

Edit 3: I think I brute forced it using Wolfram Alpha although I don't know how accurate this is. It seems that the aphelion and winter solstice could have coincided on December 16th, 9510 BC (11532 BP.)

$\endgroup$
4
  • $\begingroup$ If you read that the calculation is more complicated: what and where? What is your guess based on? $\endgroup$ Commented Jun 14, 2022 at 16:17
  • $\begingroup$ I read that in the climate section of this article. My guess is just half the precession period plus the time since the Dec. solstice was at perihelion but assumes that that occurred exactly half-way through the period which is likely false but is probably in the ballpark... $\endgroup$
    – A. Bear
    Commented Jun 14, 2022 at 16:27
  • $\begingroup$ My guess is you really mean "coincided within 24 hours". Both the solstice and aphelion are just instants in time, and they likely never coincide exactly. An implementation of the latest precession algorithm is here: iausofa.org/2021_0125_C/sofa/pfw06.c $\endgroup$ Commented Jun 14, 2022 at 18:39
  • $\begingroup$ @GregMiller Yes, thanks, I do mean coincide within 24 hours. I edited the question accordingly. I'll have a look at the code. $\endgroup$
    – A. Bear
    Commented Jun 15, 2022 at 4:44

1 Answer 1

12
$\begingroup$

Using JPL Horizons, I found that Earth's aphelion last occurred near the northern winter solstice some time around 9540 BC.

There might be a clever way to get this info from Horizons, but I just used crude estimates and trial & error. This task is a bit tricky. To get accurate results, you need to use the Terrestrial Time (TT) scale; in that epoch, the uncertainty in the difference between Universal Time and TT is rather large.

As I mentioned here, the exact time of Earth's perihelion and aphelion is a little wobbly, mostly because of the influence of the Moon. However, the perihelion and aphelion of the Earth-Moon barycentre (EMB) are more stable, although they do get affected slightly by perturbations from the other planets (I assume Jupiter & maybe Venus are the main culprits). Fortunately, in 9542 BC, the aphelion of the EMB and of the Earth itself are fairly closely aligned.

Here's a graph of the distance from the Sun to the Earth (in blue) and to the EMB (in red). The "+1.525e8" means you need to add 152.5 million km to the numbers on the vertical axis. (For reference, the mean radius of the Earth is 6371 km).
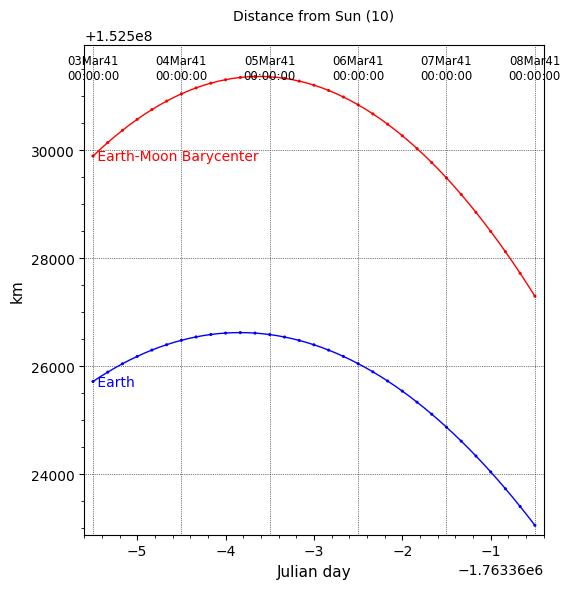
Aphelion 9542 BC

And here's the corresponding graph of the Sun's declination.
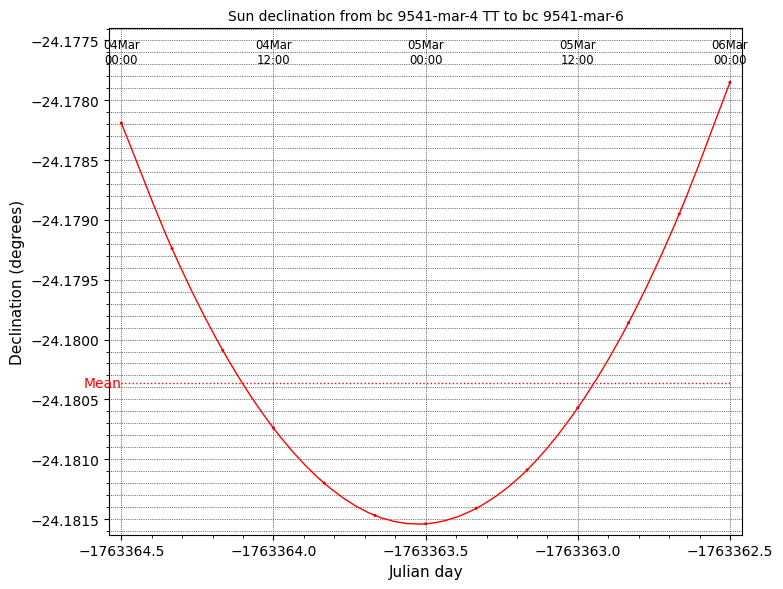
Capricorn solstice 9542 BC

Those graphs say that aphelion and solstice occur around midnight on the 5th of March, 9541 BC, or Julian day -1763363.5. Horizons uses the Julian calendar for dates prior to 1582-Oct-15. The equivalent (proleptic) Gregorian calendar date is the 22nd of December, 9542 BC.

FWIW, the aphelion coincided with the June solstice in 1250 AD. It coincided with the March equinox around 4100 BC, and will coincide with the September equinox around 6450 AD.


I just want to say a little more about the variation in the time of perihelion / aphelion. Here's a plot for the year 2000 of the distance from the Sun to the Earth and to the EMB. At this scale, the graphs overlap almost perfectly. That ±~5000 km monthly variation due to the Earth's orbit around the EMB (which you can see in a graph in my linked answer) is pretty small compared to the 5 million km difference between perihelion & aphelion. But as the top graph in this answer shows, we can see the difference if we zoom in close enough.

Distances from Sun to Earth & EMB

The year doesn't contain a whole number of synodic months, so the effect of the Earth-EMB orbit on the exact time of Earth's perihelion varies from year to year.

Here's an anim covering the years 2000 to 2019 for 30 days around perihelion. The dots are 1 day apart, but the curves were calculated using 6 hour steps. The frame step is a Julian year of 365.25 days, rather than a calendar year, to (mostly) eliminate the shift due to the leapyear cycle.
New Anim of perihelion variation

The previous version of this anim is https://i.sstatic.net/F86um.gif


The aphelion plot was done using a slightly updated version of the script in this answer: https://space.stackexchange.com/a/58339/38535

The perihelion plot was done using a hacked version of that script. Sorry, but it's a bit too ugly to post. ;)

Here's the Sage / Python Declination script. Please see the Horizons manual for info on the various time formats that Horizons understands.

Here's a converter for Julian day numbers / Gregorian dates / Julian dates. Note that it uses Astronomical years i.e., 1 AD = year 1, 1 BC = year 0, 2 BC = year -1, etc. The code is also available on GitHub.

$\endgroup$
5
  • $\begingroup$ Wow. This will take me some time to understand and process, but I'm glad that you landed in the same century as W|A with a second data source. I had no idea Horizons existed! What an exciting treasure trove. I'll have a look at the tutorial. I'll probably accept this answer if something even more impressive doesn't show up here. Thank you. p.s. I appreciate the extra info. I was actually wondering about that wobble. $\endgroup$
    – A. Bear
    Commented Jun 17, 2022 at 14:07
  • 1
    $\begingroup$ @A.Bear No worries. Horizons is awesome. :) It gives you a direct pipeline to the JPL ephemeris which has been the source of data for the almanacs produced by the USNO & the British Navy since the mid 1980s. And of course NASA use that data for their space missions. $\endgroup$
    – PM 2Ring
    Commented Jun 17, 2022 at 14:18
  • $\begingroup$ "As of DE421, perturbations from 343 asteroids, representing about 90% of the mass of the main asteroid belt, have been included in the dynamical model." <- Wow, this is so impressive. What a fascinating read. The model and code are even open source. $\endgroup$
    – A. Bear
    Commented Jun 17, 2022 at 14:38
  • $\begingroup$ Okay, I think I understand it all now. Can you link to or describe the queries you did on Horizons though? $\endgroup$
    – A. Bear
    Commented Jun 18, 2022 at 9:45
  • $\begingroup$ Let us continue this discussion in chat. $\endgroup$
    – PM 2Ring
    Commented Jun 18, 2022 at 10:17

You must log in to answer this question.

Not the answer you're looking for? Browse other questions tagged .