Fixed typo.
Link
Peter Erwin
  • 18.4k
  • 1
  • 43
  • 59

How was this interstellar fireball observed and it'sits trajectory analyzed?

Tweeted twitter.com/StackAstronomy/status/1121021187713380353
added 2 characters in body
Source Link
uhoh
  • 30.7k
  • 9
  • 98
  • 313

The short, interesting paper Discovery of a Meteor of Interstellar Origin describes a proposed discovery of a second interstellar object. This one hit the Earth, and was discovered not by telescope, but by "data mining" the CNEOS fireball catalog https://cneos.jpl.nasa.gov/fireballs/

It is not hard to find in the table based on the date given in the paper, but the information listed is sparse, there's no ID number or information how this was obtained:

peak brightness UTC   lat     lon    alt(km)  v(km/s)  vx     vy     vz 
2014-01-08 17:05:34   1.3S   147.6E   18.7     44.8,    -3.4  -43.5  -10.3 

total radiated kJ   calc total imact kt
     3.1e10,                 0.11

Question: With what instrument was this particular fireball observed and recorded, and how was it analyzed and processed into a trajectory and state vector to be entered into this table?


Fig. 1, Discovery of a Meteor of Interstellar Origin

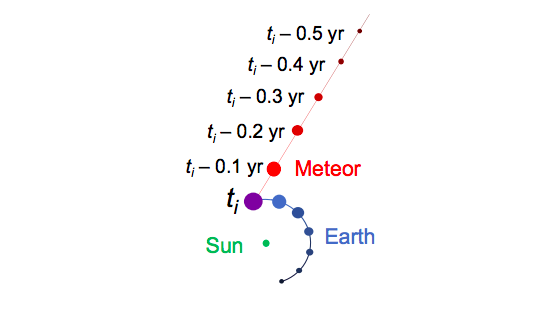
Figure 1. Trajectory of the January 8, 2014 meteor (red), shown intersecting with that of Earth (blue) at the time of impact, ti = 2014-01-08 17:05:34.

enter image description here

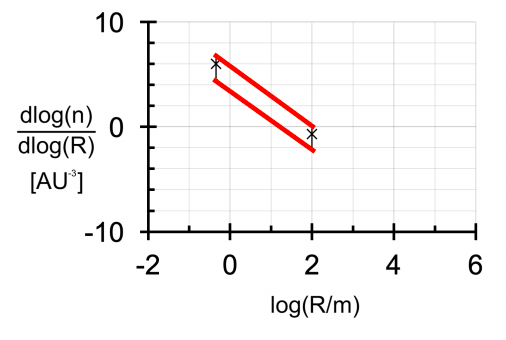
Figure 2. Size distribution of interstellar objects based on the detection of ‘Oumuamua and of the meteor detected at 2014-01-08 17:05:34 UTC. Red lines indicate the envelope for possible power-law fits (slopes of -1.9 to -3.8), given 95% Poisson distribution confidence intervals on each number density (based on a single detection for each). The range of possible power-law slopes is consistent with that inferred for small bodies in the Kuiper belt, -2.5 to -3 (Kenyon & Bromley 2004).
The short, interesting paper Discovery of a Meteor of Interstellar Origin describes a proposed discovery of a second interstellar object. This one hit the Earth, and was discovered not by telescope, but by "data mining" the CNEOS fireball catalog https://cneos.jpl.nasa.gov/fireballs/

It is not hard to find in the table based on the date given in the paper, but the information listed is sparse, there's no ID number or information how this was obtained:

peak brightness UTC   lat     lon   alt(km)  v(km/s)  vx     vy     vz 
2014-01-08 17:05:34   1.3S  147.6E  18.7    44.8,    -3.4  -43.5  -10.3 

total radiated kJ  calc total imact kt
    3.1e10,                 0.11

Question: With what instrument was this particular fireball observed and recorded, and how was it analyzed and processed into a trajectory and state vector to be entered into this table?


Fig. 1, Discovery of a Meteor of Interstellar Origin

Figure 1. Trajectory of the January 8, 2014 meteor (red), shown intersecting with that of Earth (blue) at the time of impact, ti = 2014-01-08 17:05:34.

enter image description here

Figure 2. Size distribution of interstellar objects based on the detection of ‘Oumuamua and of the meteor detected at 2014-01-08 17:05:34 UTC. Red lines indicate the envelope for possible power-law fits (slopes of -1.9 to -3.8), given 95% Poisson distribution confidence intervals on each number density (based on a single detection for each). The range of possible power-law slopes is consistent with that inferred for small bodies in the Kuiper belt, -2.5 to -3 (Kenyon & Bromley 2004).

The short, interesting paper Discovery of a Meteor of Interstellar Origin describes a proposed discovery of a second interstellar object. This one hit the Earth, and was discovered not by telescope, but by "data mining" the CNEOS fireball catalog https://cneos.jpl.nasa.gov/fireballs/

It is not hard to find in the table based on the date given in the paper, but the information listed is sparse, there's no ID number or information how this was obtained:

peak brightness UTC   lat     lon    alt(km)  v(km/s)  vx     vy     vz 
2014-01-08 17:05:34   1.3S   147.6E   18.7     44.8   -3.4  -43.5  -10.3 

total radiated kJ   calc total imact kt
     3.1e10                0.11

Question: With what instrument was this particular fireball observed and recorded, and how was it analyzed and processed into a trajectory and state vector to be entered into this table?


Fig. 1, Discovery of a Meteor of Interstellar Origin

Figure 1. Trajectory of the January 8, 2014 meteor (red), shown intersecting with that of Earth (blue) at the time of impact, ti = 2014-01-08 17:05:34.

enter image description here

Figure 2. Size distribution of interstellar objects based on the detection of ‘Oumuamua and of the meteor detected at 2014-01-08 17:05:34 UTC. Red lines indicate the envelope for possible power-law fits (slopes of -1.9 to -3.8), given 95% Poisson distribution confidence intervals on each number density (based on a single detection for each). The range of possible power-law slopes is consistent with that inferred for small bodies in the Kuiper belt, -2.5 to -3 (Kenyon & Bromley 2004).

Source Link
uhoh
  • 30.7k
  • 9
  • 98
  • 313

How was this interstellar fireball observed and it's trajectory analyzed?

The short, interesting paper Discovery of a Meteor of Interstellar Origin describes a proposed discovery of a second interstellar object. This one hit the Earth, and was discovered not by telescope, but by "data mining" the CNEOS fireball catalog https://cneos.jpl.nasa.gov/fireballs/

It is not hard to find in the table based on the date given in the paper, but the information listed is sparse, there's no ID number or information how this was obtained:

peak brightness UTC   lat     lon   alt(km)  v(km/s)  vx     vy     vz 
2014-01-08 17:05:34   1.3S  147.6E  18.7    44.8,    -3.4  -43.5  -10.3 

total radiated kJ  calc total imact kt
    3.1e10,                 0.11

Question: With what instrument was this particular fireball observed and recorded, and how was it analyzed and processed into a trajectory and state vector to be entered into this table?


Fig. 1, Discovery of a Meteor of Interstellar Origin

Figure 1. Trajectory of the January 8, 2014 meteor (red), shown intersecting with that of Earth (blue) at the time of impact, ti = 2014-01-08 17:05:34.

enter image description here

Figure 2. Size distribution of interstellar objects based on the detection of ‘Oumuamua and of the meteor detected at 2014-01-08 17:05:34 UTC. Red lines indicate the envelope for possible power-law fits (slopes of -1.9 to -3.8), given 95% Poisson distribution confidence intervals on each number density (based on a single detection for each). The range of possible power-law slopes is consistent with that inferred for small bodies in the Kuiper belt, -2.5 to -3 (Kenyon & Bromley 2004).