This question asks about an algorithm used in Project DAMIT.
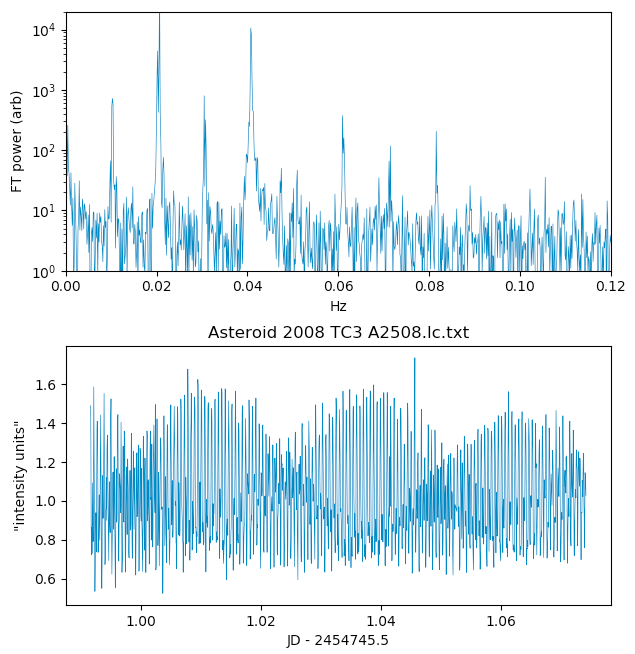
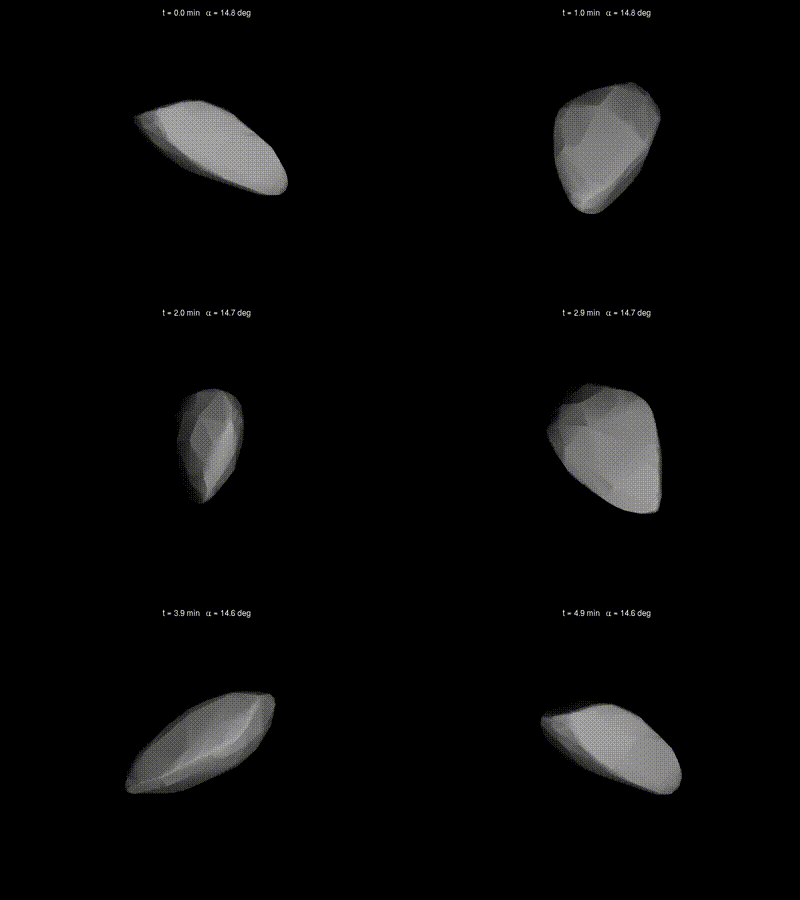
@RobJeffries' answer led me to Wikipedia's William Herschel Telescope which led me to Wikipedia's 2008 TC3 which led me to the animation 2008 TC3 Tumbling (reduced).gif which led me to https://astro.troja.mff.cuni.cz/projects/damit/asteroids/view/2508 where I see two pages listed for light curve data. I've plotted them below.
The web site says that the reconstruction of the shape and tumbling of the asteroid is done as described in their documentation page:
DAMIT asteroid models
DAMIT contains asteroid models that were derived using the light-curve inversion method developed by Kaasalainen & Torppa (2001) and Kaasalainen et al. (2001), combined with other inversion techniques in some cases. Each model in DAMIT references the original paper(s) where it was published. Please note that the models presented in DAMIT may differ from those published in the original papers. The main reason for this is a limited dataset used in the original publication and/or a narrow range of periods scanned during the inversion.
Question: As both parts of the paper are paywalled in Icarus is it possible to generate a straightforward description of the basic idea behind how this reconstruction process generates a shape from an $I(t)$ plot?
For delay-doppler radar observations there is a rich set of data available, but here there is only intensity vs time. How can a 3D shape be unambiguously determined from what looks like a pretty chaotic set of data?
I plotted the data just for kicks.

