0
$\begingroup$

I'm looking for the distribution of spectral types in the "giant" star category. This category is defined as basically B and O main sequence stars and any star that is larger than main sequences outside of it.

My first thought was that the M, K, G, F, and A type distribution were the same as they are in the main sequence but then I realized M has to be dropped, and then i'm not quite sure how K, G, F, and A types evolve and usually only Red Giants are mentioned and I couldn't find numbers for the giants so I'm stuck.

To be clear, I want to know the percentage of giant stars that are in each of the spectral types. So if there are 1000 stars in a given area and 100 giant stars in that areas I only want to know the percentage of each spectral type of the stars in that 100.
$\endgroup$
3
  • $\begingroup$ I can't work out what it is you want to know, or what you've done to find an answer. $\endgroup$
    – ProfRob
    Commented Oct 2, 2016 at 20:06
  • $\begingroup$ @RobJeffries Does that new added last paragraph help? $\endgroup$
    – Durakken
    Commented Oct 2, 2016 at 20:20
  • $\begingroup$ So essentially you want to know the temperature distribution of giants, where your definition of giant includes main sequence OB stars. $\endgroup$
    – ProfRob
    Commented Oct 2, 2016 at 20:44

1 Answer 1

3
$\begingroup$

OK, I see what you want.

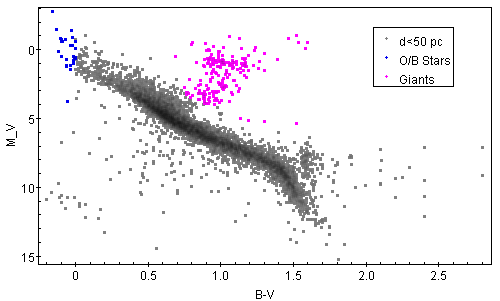
What I did was take the revised Hipparcos catalogue and select all stars closer than 50pc. At this distance there should be a complete sample of the types of stars you were interested in. I can plot an absolute magnitude versus colour diagram for these 7096 stars (see below) and use this to select giants and OB main sequence stars.

I do this by using data from chapter 2 of Zombeck (1992), I define O and B main sequence stars to have $B-V<0$ and $M_V<5$ (to exclude hot white dwarfs). Evolved giants are selected (a bit arbitrarily) to lie significantly above the main sequence.

Stars closer than 50pc

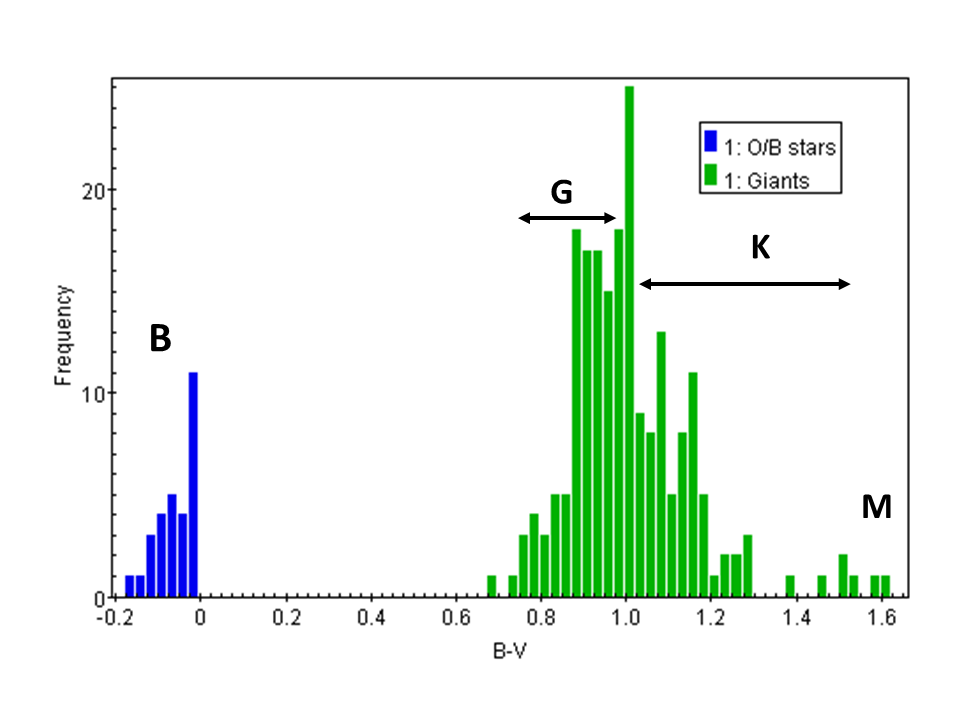
Then I can plot a frequency histogram of the B-V values of those stars and label them with spectral types, again according to tables in Zombeck (1992). The result is seen below.

Distribution of "giant stars"

Of these 235 stars: None are O stars, 29 are B stars, about 120 are G giants, about 80 are K giants and only 2-3 are M giants

$\endgroup$
12
  • $\begingroup$ I think I'm misunderstanding something. I thought that Red Gian and Supergiants were the dominant, but your answer seems to indicate Yellow Giants are the dominant and there are barely any Reds... $\endgroup$
    – Durakken
    Commented Oct 3, 2016 at 2:25
  • $\begingroup$ @Durakken It is what it is. Of course if you were interested in a magnitude limited sample, rather than a volume limited sample, the answer might be different. Perhaps I have misinterpreted what you meant bt "stars in a given area"? $\endgroup$
    – ProfRob
    Commented Oct 3, 2016 at 6:36
  • $\begingroup$ @Durakken Also, all of the giants are redder than the Sun. $\endgroup$
    – ProfRob
    Commented Oct 3, 2016 at 6:39
  • $\begingroup$ i think the issue is that I'm thinking that there are a class for each spectral type, when it now seems that all spectral types are wrapped up in the terms/classes Red Giant, Red Supergiant, and Yellow Hypergiants which are special specific instances... So my question isn't right to what i needed to know, but your answer helped with what i really did. $\endgroup$
    – Durakken
    Commented Oct 3, 2016 at 12:29
  • $\begingroup$ @Durakken There are no "hypergiants" or "supergiants" in the sample above. These are rare (but luminous). $\endgroup$
    – ProfRob
    Commented Oct 3, 2016 at 12:41

You must log in to answer this question.

Not the answer you're looking for? Browse other questions tagged .