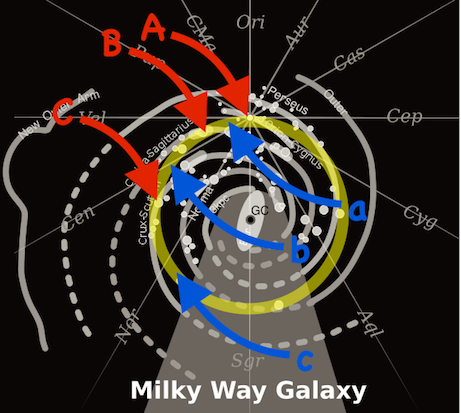
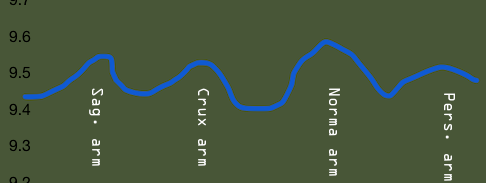
I'm afraid there is no answer, yet... The problem is that you would have to know the star densities in the different regions (in the spiral arms and outside of the spiral arms). While it is certainly possible to have an accurate estimate of the density of massive stars because of their brightness, the density of low mass stars in different regions of the galaxy is much more difficult to estimate. And since low mass stars make up the vast majority of stars (see for instance the initial mass function which is a measure of the distribution of stars over the different masses), estimating the density of stars in different regions becomes very uncertain.
But, at the moment the Gaia satellite is measuring the position and distances of about a billion stars and other objects. A much more detailed three dimensional map will be created with that data, including distance data for dim stars whose distances we were as yet unable to measure. So there is hope ;-)
NB. The first data release of Gaia has been published in September. I haven't found any papers that were able to answer your question (my search was not extensive though), but they might be forthcoming. Of course if you have some programming skills, you might determine the density differences from the data (available here) yourself.
EDIT - Just took a look at the data, the parallax (and therefore the distance) is still lacking for many stars. Hopefully this will change with future data releases.
= I understand that one of the reasons the arms "appear real" is just that there are more bright young stars forming in the arms (due to the
higher pressure). Perhaps the actual density difference is very low?
I would expect that the density difference of stars is quite small.
= Perhaps the density variation is dependent on the type of star, or other material - what about things like gasses?
The density variation is certainly different between different types of stars. High mass stars only occur near star forming regions (i.e. in spiral arms). Their lifespan is so short that they do not have the time to get very far from the region in which they were formed.
I'd expect that the density variation for gas and dust will be higher (but I have no knowledge to support this).

