The Science News article An orbiter glitch may mean some signs of liquid water on Mars aren’t real begins:
Some signs of water on Mars may have just dried up.
Thanks to the way data from NASA’s Mars Reconnaissance Orbiter are handled, the spacecraft may be seeing signs of hydrated salts that aren’t really there, planetary scientists report online November 9 in Geophysical Research Letters.
That lack of salts could mean that certain sites proposed as places where life could exist on Mars today, including purported streaks of liquid water on the walls of Martian craters, are probably dry and lifeless.
“People think these environments might be inhabitable by microbes,” says planetary scientist Ellen Leask of Caltech. But “there might not actually be any real evidence for it,” at least not from orbit.
Leask and her colleagues found the problem while searching for hydrated salts called perchlorates in maps of Mars taken by the orbiter’s Compact Reconnaissance Imaging Spectrometer for Mars, or CRISM. Perchlorates can lower the freezing point of water by up to 80 degrees Celsius, which could be enough to melt ice in the frigid Martian climate.
The report is Open Access in Geophysical Research Letters: Challenges in the Search for Perchlorate and Other Hydrated Minerals with 2.1‐μm Absorptions on Mars Leask, E. K., Ehlmann, B. L., Dundar, M. Murchie, S. L. Seelos, F. P., https://agupubs.onlinelibrary.wiley.com/doi/abs/10.1029/2018GL080077
The data in question comes from Mars Reconnaissance Orbiter's CRISM (Compact Reconnaissance Imaging Spectrometer for Mars), a Vis-NIR push broom hyperspectral imager, where a 1D line image is cross-dispersed in wavelength and recorded on a 2D array as the spacecraft moves over Mars' surface.
If I understand correctly, during later image analysis and , some of the corrections to the data meant to compensate for "spikes" in some observables (despiking) occurring during large changes in brightness resulted in spectral features that suggested presence of hydrated minerals that didn't exist.
Question: But I find the description of the step in the analysis responsible for the error a little bit complicated. Is it something simple like division by very small values leading to the spike in a derived quantity, followed by heavy-handed interpolation to smooth it over? What exactly does it mean when they talk about a few pixels, are there some physical locations on the detector that behave differently, or a spectral hot spot from artifacts in the grating? (e.g. Woods anlomalies)? “But for 0.05 percent of the pixels, it smooths out in a way that looks like perchlorate.”
Potentially helpful resource: Regularization of Mars Reconnaissance Orbiter CRISM along‐track oversampled hyperspectral imaging observations of Mars
Any help translating the "processingese" language to something easier to understand for a non-astronomer would be a great help!
More from the Science News article:
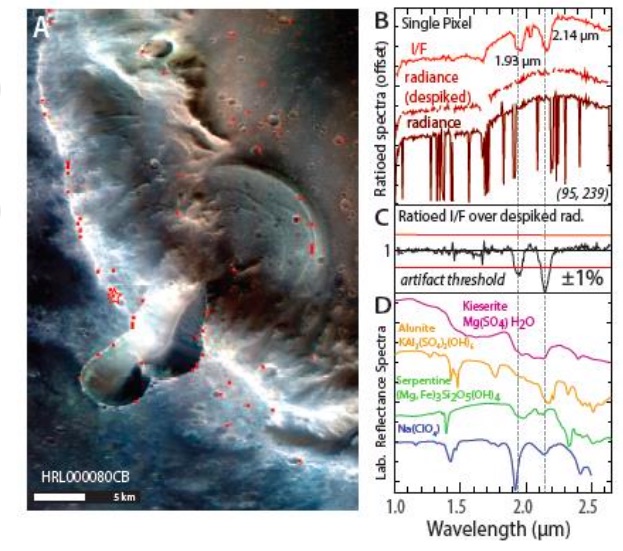
CRISM’s camera doesn’t work perfectly, though. It can be thrown off by boundaries between light and dark, like a shadowed region at the edge of a cliff. Some pixels in the orbiter’s camera take a fraction of a millisecond to realize the surface color changed, so they record an extra spot of light or dark where it shouldn’t be. Planetary scientists have software to correct for these “spikes” in the spectra and make the data more reliable and easier to read.
But the correction sometimes introduces dips in the spectra at the same wavelengths as perchlorates, Leask and Ehlmann and their colleagues found. “We cleverly created a way to get rid of the spiky noise,” Ehlmann says. “But for 0.05 percent of the pixels, it smooths out in a way that looks like perchlorate.”
The researchers found the glitch while looking for small signs of the salts in CRISM images. Assuming that the orbiter would have already spotted large deposits of perchlorates if they existed, the team wrote an algorithm to find smaller traces that covered fewer than 10 pixels in a CRISM image. And the scientists started seeing perchlorates everywhere, including Jezero crater, which NASA announced was selected as the landing site for the Mars 2020 rover on November 19 (SN Online: 11/19/18).
© 2018 American Geophysical Union. All rights reserved.
Figure 1.Example of the (a) spatial and (b) spectral appearance of the artifact creating the spurious absorptions, shown in ratioed I/F and ratioed radiance. The threshold for an artifact is defined to be where ratioed radiance differs from ratioed I/F by more than 1% (c). Laboratory spectra of minerals with a 2.1-μm absorption are shown (d) for comparison (from USGS spectral library (Clark et al. (2007)) and Hanley et al. (2015)).
