This GIF is made (via giphy.com) from the new NASA Goddard video Hubble's New Image of Interstellar Object and if I understand correctly many (if not all) of these frames are from https://archive.stsci.edu/proposal_search.php?mission=hst&id=16009 (from this answer).
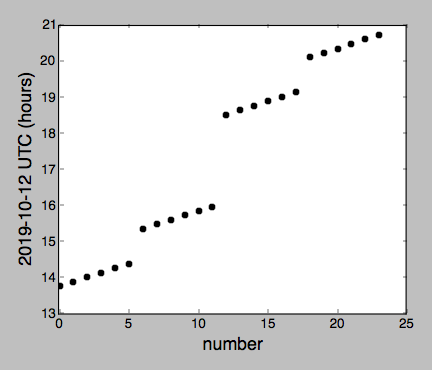
I have some questions about this set of images. I've plotted the start times below.
- There are four groups that last about 45 minutes, each followed by a break of either 45 minutes or 90+45 minutes, is this related to the HST's orbit?
- I notice a slow rotation of the star tracks over the duration of the roughly seven hours of data, it looks like roughly 20 degrees, (see GIF or the individual images) and I can't figure that out at all. Is it a rotation of the HST around its own axis?
- Individual preview images (example) appear to be rhomboidal rather than square, why?

