2
$\begingroup$

@JamesK's answer to When will the next transit of Earth be visible from Mars? Was the last one really on May 11, 1984? lists dates of 18 transits which I've converted to days since 1500-Jan-01 as

[35011, 44319, 73176, 109885, 138742, 148050, 176908, 213616, 242474, 251782, 280639, 317347, 326656, 346205, 355514, 384371, 421078, 430388]

Answers to Why do transits of Earth across the Sun seen from Mars follow a pattern of occurring after 26, 79 then 100 years? explain why this happens and why if they happen at all, the happen in May and November.

As an exercise I'd like to use folding to see if I can detect those or similar periodicities in addition to the 6 month periodicity.

I could

  1. for each period of N days recalculate those modulo N
  2. histogram the results

but since there are so few event, they rarely occur when their time comes, and so many days between events, there won't be obvious peaks in the resulting histogram.

Question: Is there a technique for folding sparse event data in order to detect an underlying periodicity?


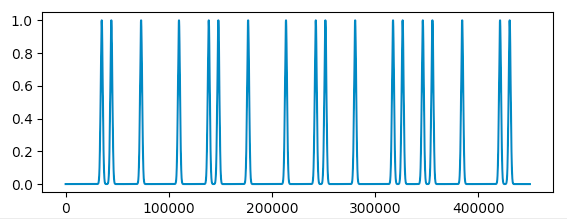
Events convoluted with σ=1000 day gaussians purely for illustration purposes. I thought about applying some Fourier transform to this but I don't think that that makes sense, and would be cheating rather than folding.
enter image description here

$\endgroup$
1

2 Answers 2

3
+50
$\begingroup$

While this is not exactly how folding works, one-dimensional data encourages trying some simple statistical tallying first.


What very easily reveals those periodicities is just tallying up the deltas, with an appropriate fuzziness for what periodicities are relevant:
  1. Deltas

[0, 9308, 28857, 36709, 28857, 9308, 28858, 36708, 28858, 9308, 28857, 36708, 9309, 19549, 9309, 28857, 36707, 9310]

Already here, some patterns should be apparent. But we have some extra information that could be used to filter out the short period noise.

  1. Rounding at an appropriate sampling frequency

Earth transits aren't going to happen every day. If there was an Earth transit yesterday, it can't happen again today, or next day, or even the next month. In fact, we know they can only happen once for every synodic period of Mars-Earth (780 days).

To not miss out in any "legitimate" part of the signal, we should sample at at least twice of that rate. "one year" happens to be pretty close to half of 780 days.

The periodicity is then readily visible:

[26, 79, 101, 79, 26, 79, 101, 79, 26, 79, 101, 26, 54, 26, 79, 101, 26]

Which also reveals an even higher extra periodicity of about 206 years.

With a strong 206 year periodicity found in a set of events only covering a little over 400 years, there's not enough data to with any certainty detect any higher order periodicities that that.

$\endgroup$
3
  • $\begingroup$ Is how astronomers implement folding? $\endgroup$
    – uhoh
    Commented Oct 3, 2020 at 23:50
  • $\begingroup$ @uhoh I will delete this is if the example data wasn't the point of your post. Sometimes simple methods are useful. $\endgroup$ Commented Oct 4, 2020 at 0:02
  • 1
    $\begingroup$ It's up to you but I don't think it's necessary. My comment asks for clarification. If this is how folding works you can mention that this is "some insight into" or "the basic idea". If not, you can say "while this is not exactly how folding works, it may get you started" or anything else that offers guidance how this applies to folding. Since someone has added a bounty to the question I feel additional responsibility for encouraging clarity on how well an answer addresses the question as asked. $\endgroup$
    – uhoh
    Commented Oct 4, 2020 at 0:09
2
+100
$\begingroup$

Folding introduction and example:

Folding is a signal processing technique typically used to extract and characterize low SNR (signal to noise ratio) electromagnetic pulses from time domain series data. The techniques were developed to support radar processing long before the first pulsar was discovered, but I don’t know if astronomers developed it independently.

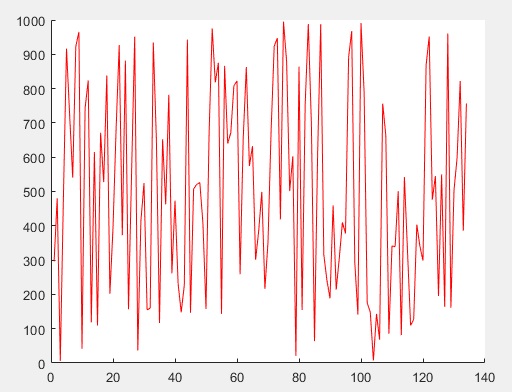
Let’s simulate some pulses based on the first pulsar found, the PSR B1919+21. This pulsar has a period of about 1.34 seconds, and a PW of 0.04 seconds. Let’s suppose our detector is not too great and we sample at 0.01 seconds from the absolute value of a uniform distribution with a mean of 400 photons, standard deviation of 200 photons, so a single simulated noiseless pulse in the time domain looks like this:

enter image description here

The x-axis is samples at 0.01 seconds. The y-axis is photon count. Then let’s produce some noise using the absolute value of a mean of 0 with 1000 standard deviation.

enter image description here

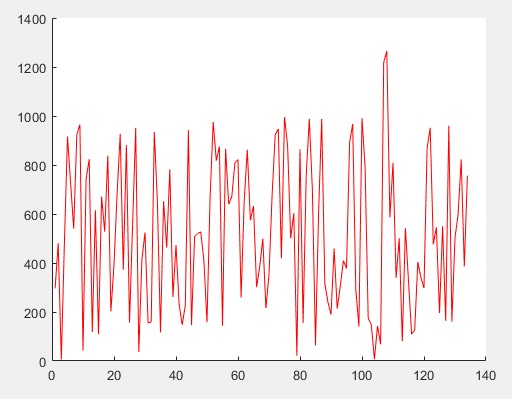
Then let's add the noise and the pulse together. This is what our simulated detector sees for a faint pulsar:

enter image description here

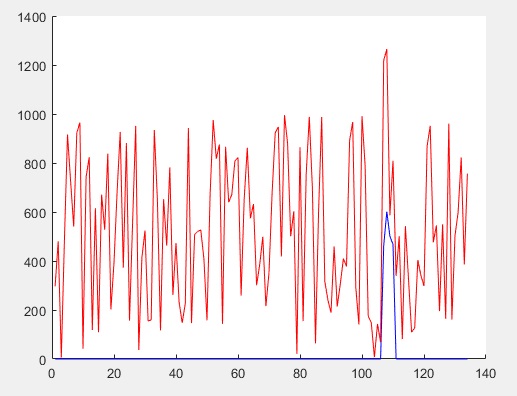
The pulse barely clears the noise floor, and we wouldn't be able to determine that it's 0.04 seconds wide just from this data. Here is the pulse and detection plotted together:

enter image description here

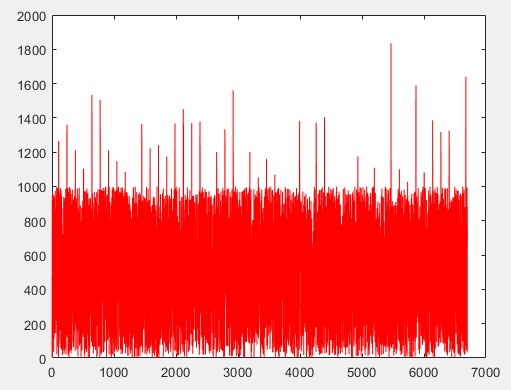
We can capture 50 pulses by observing the signal for over a little more than a minute duration:

enter image description here

If we divide all the observational data into 50 separate windows (with a good guess for period) we can add all the windows together (element wise). In the new window, the pulse is clear, since the noise tends to cancel out, and the signal compounds.

enter image description here

If the pulse were more complicated, we could start to see subtle structure by this folding technique for longer observation times even in the presence of a lot of noise.

Answer:

Now that we've introduced folding, lets get to the actual answer. There is no good reason to apply data folding to transit times of Mars, since the data set has no noise. I believe that the differencing techniques applied by '@SE – stop firing the good guys' is the best technique.

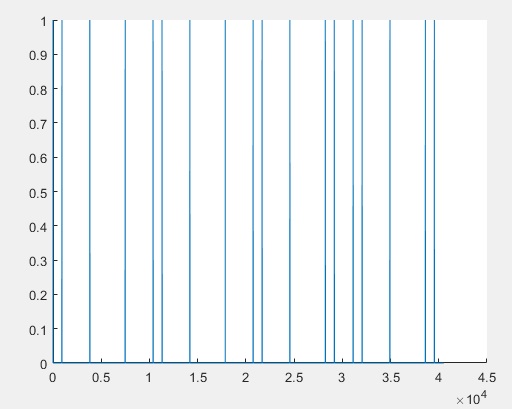
However, I like pounding in nails with a screw driver and we can pickle that! Let's cut out the leading zeros and divide the days by 10 and round so we don't get 'off by one' alignments when we fold. Then let's create a square wave for each transit:

enter image description here

We can chop it into 4 equally sized windows:

enter image description here

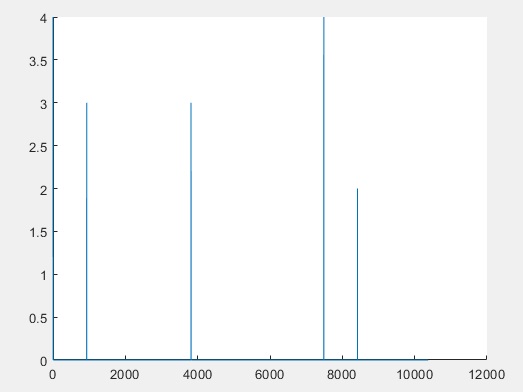
And add all the windows to get:

enter image description here

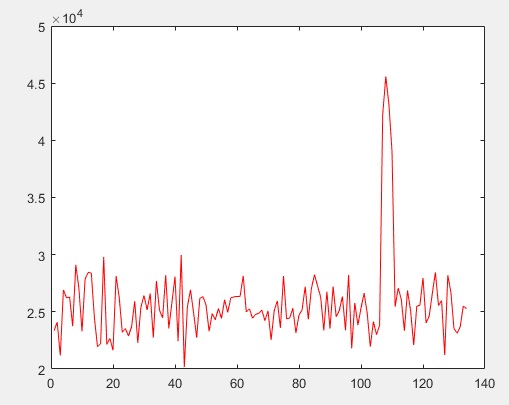
Since our window was 103730 days, it reveals a periodicity of about 284 years. To quote the other answer, "there's not enough data to with any certainty detect any higher order periodicities that that."

Notes:

  1. Using folding on transit time data the way I have, is not an appropriate use of the technique, I think. It can work, but it is overkill.

  2. The other answer of a periodicity of 26+79+101=206 years, I respectfully believe is an error. They should have added the first 4 gaps and subtracted 1 to get 26+79+101+79-1=284 years, which is my answer. Their technique is still superior to the one I use here.

  3. Picking the right window size for folding is key to get the technique to work. If you don't know the window size, you can try many window sizes and pick the one with the maximum response. Some folks also use raster plots.

  4. This technique is important for detecting and determining glitches for faint pulsars.

  5. One could certainly use this technique for other periodic phenomena in the presence of noise, like finding planet transits across stars in other planetary systems. This would be an especially interesting application since, instead of a spike, we would expect a 'dip' in the folded data where the detected energy of the star was lower when the planet passed in front.

$\endgroup$
5
  • 1
    $\begingroup$ I am also happy to provide my code on request. $\endgroup$
    – Connor Garcia
    Commented Nov 26, 2020 at 21:53
  • 1
    $\begingroup$ Thank you for your thorough and systematic answer! "since the data set has no noise" There may not be noise in amplitude (signal is either 0 or 1) but there is certainly noise in time. Since Mars' orbit is substantially elliptical and there is no simple relationship between Earth and Mars orbital periods (e.g. it's not 3:2 for example) the transits will come "early" or "late" wrt circular orbits of the same period. I'm therefore a little surprised at the narrowness of your peaks, it's not what I expected! I haven't had my morning coffee yet so will back later today once all cylinders firing... $\endgroup$
    – uhoh
    Commented Nov 26, 2020 at 23:13
  • 1
    $\begingroup$ it's always possible that my input data doesn't reflect reality, or that the bin size here is sufficiently large that the effect is too small to be resolved. $\endgroup$
    – uhoh
    Commented Nov 26, 2020 at 23:15
  • 1
    $\begingroup$ @uhoh I don't think it would be wrong to use the normal distributions generated in your original question to 'fold' this data. There is more than one way to skin a cat! I kluged your given data set by dividing by 10 and rounding so the small offsets disappeared. And yes, I meant noise in amplitude rather than time. $\endgroup$
    – Connor Garcia
    Commented Nov 26, 2020 at 23:35
  • $\begingroup$ related in DSP SE: Finding periodicity in discrete events II - missions to Mars $\endgroup$
    – uhoh
    Commented Mar 22, 2023 at 22:22

You must log in to answer this question.

Not the answer you're looking for? Browse other questions tagged .