This is my first ever online question, so please bear with me:
I’m working on an A1-sized map of at least 100 of the largest solar system bodies (henceforth just called ‘planets’, ignorning the IAU definition), including moons, spacecraft and the nearest stars. This is just a hobby, and I’ve got no academic experience.
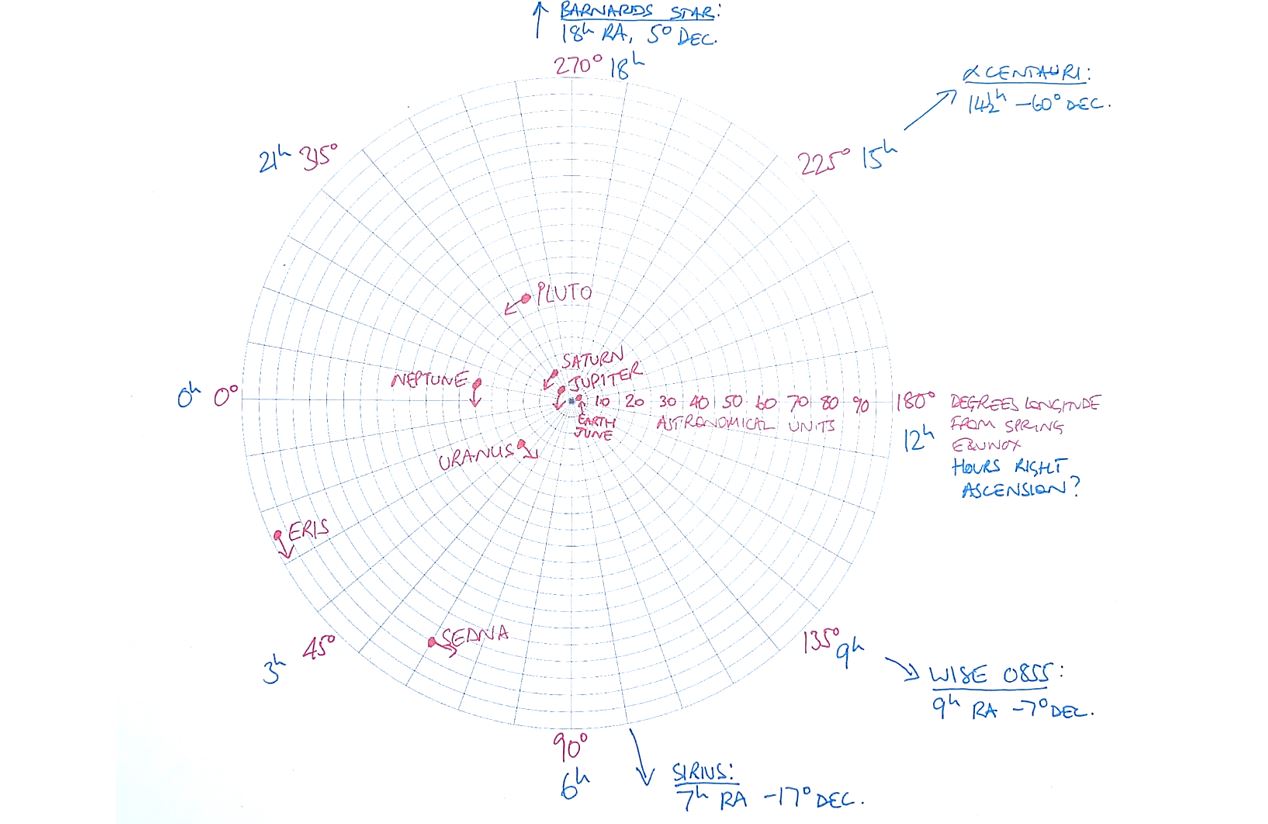
I’ve got the planets’ heliocentric longitudes, latitudes and distances from JPL Horizons, and the stars’ right ascensions, declinations and distances from Wikipedia (unless there are better sources?). I’d like to check that I’m plotting hours right ascension correctly onto my map, which uses degrees longitude for direction. I’ve attached a rough sketch, depicted looking ‘down’ from above the ecliptic. I always put 0° longitude on the left so that Pluto is towards the top.

Are these assumptions correct?
— that 0h right ascension is the same direction as 0° longitude?
— that hours of right ascension increase anti-clockwise in the same direction as degrees longitude? — that 6h right ascension is the same direction as 90° longitude, 12h = 180° and 18h = 270°?
— if these are correct, are my star directions correct, so that Barnard’s Star would be at the top of the page in the vague direction of Pluto, and Alpha Centauri is roughly the same direction from the Sun as Earth is in June?
— the planets’ locations are heliocentric, but presumably star coordinates are geocentric, but as we’re so close to our Sun in astronomical terms, would it make much difference, or is there a source of heliocentric coordinates for stars?
— I’ve assumed that stars’ degrees declination are the same direction as planets’ degrees latitude, so that if a star’s declination is +45°, is that the same latitudinal direction as a planet which is 45° above the ecliptic?
I’m plotting each planets’ location over the period of my lifetime, to get a better understanding of what’s around us, and how it changes over time. The distance scale will be quasi-logarithmic, and will be enlargened around planets to show some moons.
 The final map will therefore be a cross between the map on the left (Reddit/dawierha), showing planets with moons and trojans, and the map on the right (Wikipedia/Voyager 1), showing planets and spacecraft over a period of decades. I’ve never found a map which shows more than a few dozen planets with logarithmic scales, and/or which shows planets with moons, and/or which shows locations over time.
Sorry this question is so long, but I’ve edited it down as much as I can! Thank you.
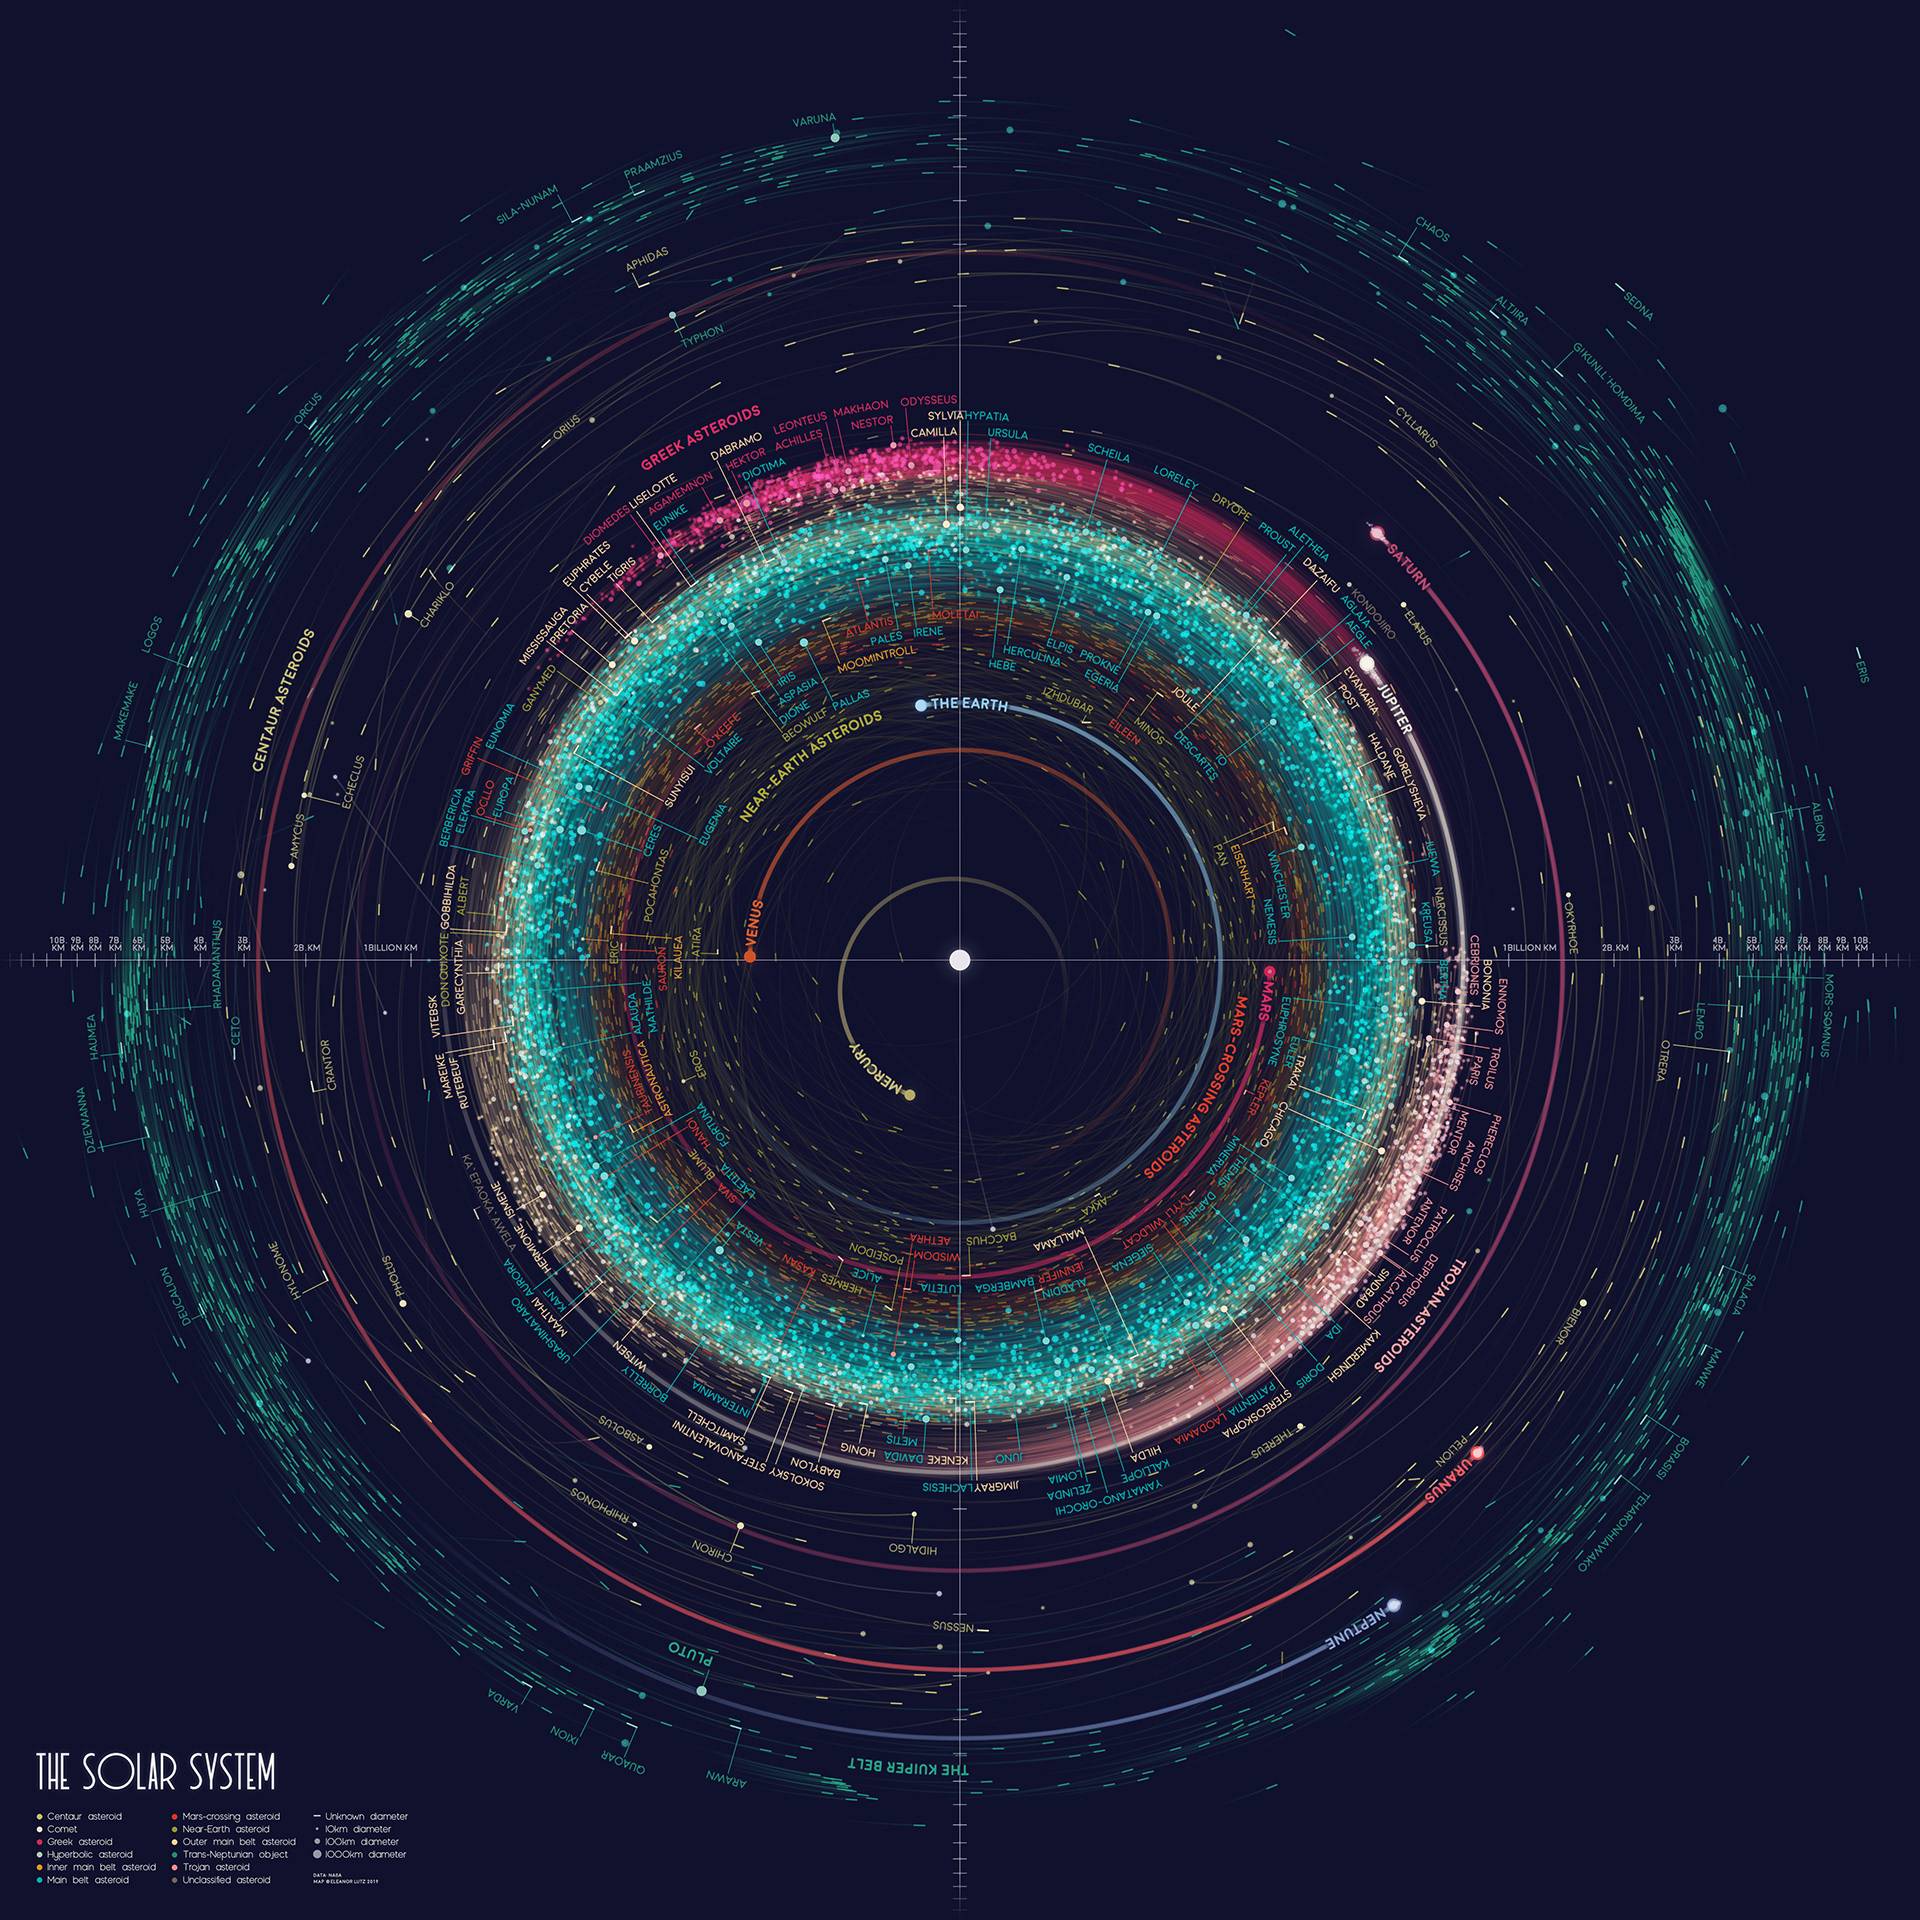
PS: One more excellent map that I found is this one from https://eleanorlutz.com/mapping-18000-asteroids — I think it's very beautiful, probably the best that I've found so far:
