tl;dr Their redshift would first decrease from $\infty$ to $\sim60$, then increase to $\infty$ again. And more eventually appear.
The answer to this question is somewhat non-trivial, and will depend on the cosmology of the universe you're considering. But in our Universe, in which dark energy supposedly accelerates expansion, what happens can be summarized as this:
Qualitative description
As time goes, light from more and more distant regions will have had the time to reach us, so new matter enters our (particle) horizon all the time. For an infinitesimally small period of time, the redshift $z$ of that matter is infinite, but will then decrease with time, as the matter moves further into our observable Universe. However, at some point later on, the accelerated expansion will speed up the matter, increasing its redshift.
Quantitative description
The behavior is best understood using comoving coordinates, i.e. the coordinates that expand along with the Universe. In these coordinates, galaxies and other matter stay fixed (except for a peculiar velocity which is of no importance to the principle). The relation between real, physical distances and comoving distances is
$$
d_\mathrm{phys} = a\,d_\mathrm{com},
$$
where $a$ is the scale factor (the "size") of the Universe, normalized to be $a=1$ today.
Consider an observer at a time when the scale factor of the Universe was $a_1$, observing light emitted earlier when the scale factor was $a_2 < a_1$. The redshift $z_{12}$ observed by this observer is
$$
z_{12} = \frac{a_1}{a_2} - 1.
$$
Now this is simple enough; the non-trivial part enters when calculating how $a$ evolves with time, which is done by integrating the Friedmann equation. This can only be solved analytically in simple cases; in general it must be solved numerically.
Numerically solving the Friedmann equation can also yield the distance to an observed object. In this way you can convert a redshift, or a corresponding scale factor, to a distance. But you can also do the opposite; that is, convert a given, observed redshift at a time $t_1=t(a_1)$ of light emitted at time $t_2=t(a_2)$ to a (comoving) distance $d_{12}$.
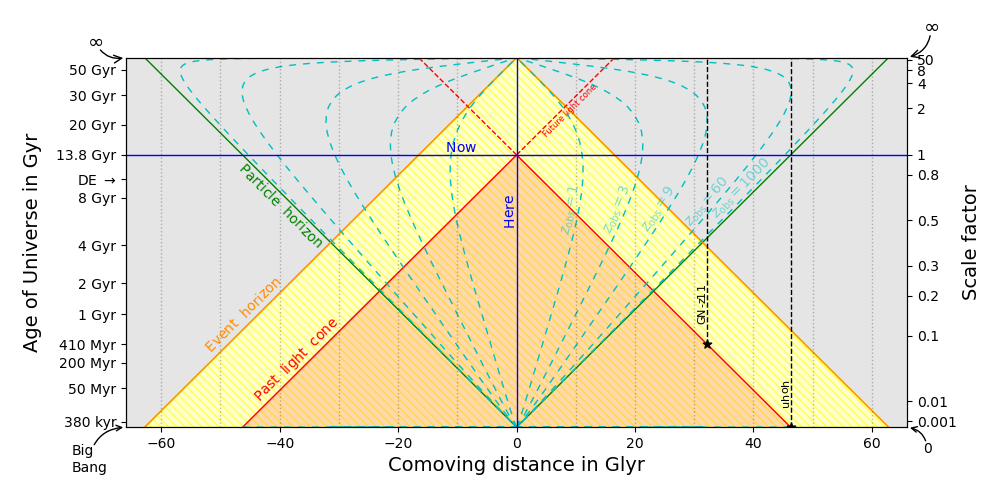
I can add the full set of equations, if you like, or you can have a look at this and this answers on physics.SE. For now, I've just implemented them in Python and plotted the (hopefully) illuminating diagram below.
Example
Below is a spacetime diagram, showing the Universe at all times (along the $y$ axis) and, correspondingly, at all scale factors, as a function of comoving distances (along the $x$ axis). A given epoch is a horizontal line (e.g. "now"), and a given position — also called a worldline — is along a vertical line (e.g. "here").
Horizons in the spacetime diagram
Everything we observe lie on our part light cone (red) which, as time goes, converges toward our event horizon (orange); the part of the Universe we will ever see. The observable Universe is the part of the "Now" line inside the green lines marking the particle horizon.
Curves of constant redshift
The dashed, cyan lines show the curves of constant redshift, calculated as described above. That is, at any time (given by a horizontal slice of your choice), a redshift (given by one of the dashed lines of your choice) will be observed for objects lying at a comoving distance given by the crossing of those two chosen lines.

As an example, let's consider the highest-redshift observed galaxy, GN-z11, which is currently observed at $z=11.1$.
The worldline of GN-z11 is show as a black, dashed line, and our view of GN-z11 today is marked by a star lying on our past light cone. GN-z11 was not inside our observable Universe at the time we see it today; it only entered our cosmic horizon (the green line) when the Universe was just over $t = 4\,\mathrm{Gyr}$ old. As time went, its redshift decreased from $\infty$,
to $100$ at $t\sim6\,\mathrm{Gyr}$,
to $30$ at $t\sim8\,\mathrm{Gyr}$,
to $11.1$ today.
In the future, GN-z11's redshift will continue to decrease to around $t\sim20\,\mathrm{Gyr}$, at which time we will observe it to have $z\sim9$. After this, it will increase without bounds.
Example #2
Now you ask specifically to "extremely redshifted galaxies", i.e. galaxies appearing now (which we would see "at the Big Bang" and hence not yet as a galaxy). The comoving distance to such a (proto-)galaxy — let's call it "$\textsf{uhoh}$" — would be (almost) equal to the distance to the particle horizon. Its worldline is marked in the spacetime diagram, and as indicated, we will see its redshift decreasing from $\infty$ to $z\simeq60$, and back to $\infty$.
When we observe $z_\mathsf{uhoh}\simeq60$, the age of the Universe will be just over $t=30\,\mathrm{Gyr}$, but we will see $\textsf{uhoh}$ as it was when the Universe was $t\simeq\mathrm{200}\,\mathrm{Myr}$ which, coincidentally, was just around the time when the first galaxies formed.
This can be seen from noticing that the worldline of $\textsf{uhoh}$ just grazes the $z_\mathrm{obs}=60$ line at $t\sim30\,\mathrm{Gyr}$, then following the $45\circ$ line from the point $\{t,d\}=\{30,0\}$ (our past light cone in the future) back to $\textsf{uhoh}$'s worldline, seeing that these lines cross at $t\simeq200\,\mathrm{Gyr}$.
In the far future, as $z_\mathsf{uhoh}\rightarrow\infty$, we will see $\textsf{uhoh}$ converge toward an age of $t\simeq500\,\mathrm{Myr}$, because this is where $\textsf{uhoh}$ crosses our event horizon.
