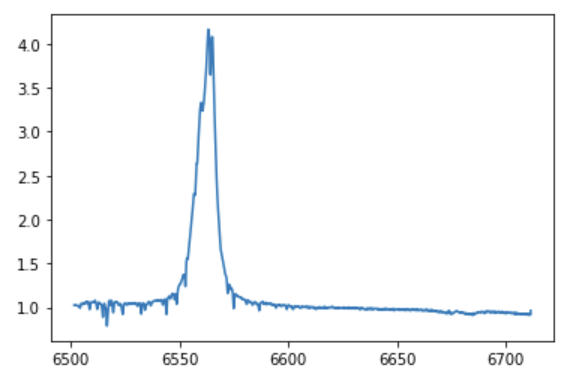
First it should be noted that the Hubble Legacy Archive is indeed legacy in the sense that parts of it no longer work and it contains no observations taken since 2017 October 1. Fortunately there is now the MAST: Barbara A. Mikulski Archive for Space Telescopes which has data from multiple missions, including HST. It also has a programmatic query interface and is supported in the Python astroquery module.
If you're happy with Python, this could provide a quick way to query and download data from MAST:
from astroquery.mast import Observations

# Query MAST for spectra from any HST instrument
obs_table = Observations.query_criteria(dataproduct_type=["spectrum"], obs_collection='HST', objectname='Phi Per')

print(obs_table[0:4])
<Table masked=True length=24>
dataproduct_type calib_level obs_collection   obs_id  target_name        s_ra        ...  intentType  obsid     objID     objID1        distance
      str8          int64         str3         str9       str7         float64       ...    str11      str8      str9      str9         float64
---------------- ----------- -------------- --------- ----------- ------------------ ... ----------- -------- --------- --------- -------------------
        spectrum           1            HST z2u91501t     INTFLAT              -99.0 ... calibration 24788087 124360412 124360412                 0.0
        spectrum           1            HST z2u91502t     INTFLAT              -99.0 ... calibration 24788088 124360413 124360413                 0.0
        spectrum           1            HST z2za0102t     HD10516     25.91564025169 ...     science 24789569 124363475 124363475 0.19245281587464713
        spectrum           1            HST z2za0202t     HD10516     25.91564060146 ...     science 24789571 124363478 124363478  1.3833132808730904
        spectrum           1            HST z3bi0102p     HD10516     25.91565050148 ...     science 24791818 124363556 124363556 0.16146879907668765
You can of course query by coordinates through the s_ra,s_dec, filter by instrument name or further filter with many other options as documented here and shown in the astroquery MAST documentation linked above.
Once you have identified data products of interest, these can be retrieved using get_product_list() e.g. as
data_products_by_obs = Observations.get_product_list(obs_table[1:3])

print(data_products_by_obs[['dataproduct_type', 'obs_id', 'description', 'type', 'dataURI','dataRights']])
dataproduct_type   obs_id                              description                             type               dataURI               dataRights
---------------- --------- ------------------------------------------------------------------- ---- ----------------------------------- ----------
        spectrum z2u91502t                                                       DADS JIF file    S mast:HST/product/z2u91502j_jif.fits     PUBLIC
        spectrum z2u91502t                                                       DADS JIT file    S mast:HST/product/z2u91502j_jit.fits     PUBLIC
        spectrum z2u91502t        DADS Q0F file - Raw data quality WFPC/WFPC2/FOC/FOS/GHRS/HSP    S mast:HST/product/z2u91502t_q0f.fits     PUBLIC
        spectrum z2u91502t   DADS SHF file - Engineering telemetry WFPC/WFPC2/FOC/FOS/GHRS/HSP    S mast:HST/product/z2u91502t_shf.fits     PUBLIC
        spectrum z2u91502t                                      DADS TRL file - Processing log    S mast:HST/product/z2u91502t_trl.fits     PUBLIC
        spectrum z2u91502t                           DADS ULF file - Data log GHRS/FOS/FOC/HSP    S mast:HST/product/z2u91502t_ulf.fits     PUBLIC
        spectrum z2u91502t                        DADS X0F file - Raw bias data WFPC/WFPC2/FOS    S mast:HST/product/z2u91502t_x0f.fits     PUBLIC
        spectrum z2u91502t                DADS XQF file - Raw bias data quality WFPC/WFPC2/FOS    S mast:HST/product/z2u91502t_xqf.fits     PUBLIC
        spectrum z2u91502t            DADS D0F file - Raw exposure WFPC/WFPC2/FOC/FOS/GHRS/HSP    S mast:HST/product/z2u91502t_d0f.fits     PUBLIC
        spectrum z2za0102t                                                       DADS JIF file    S mast:HST/product/z2za0102j_jif.fits     PUBLIC
        spectrum z2za0102t                                                       DADS JIT file    S mast:HST/product/z2za0102j_jit.fits     PUBLIC
        spectrum z2za0102t DADS Q1F file - Calibrated data quality WFPC/WFPC2/FOC/FOS/GHRS/HSP    S mast:HST/product/z2za0102t_q1f.fits     PUBLIC
        spectrum z2za0102t   DADS SHF file - Engineering telemetry WFPC/WFPC2/FOC/FOS/GHRS/HSP    S mast:HST/product/z2za0102t_shf.fits     PUBLIC
        spectrum z2za0102t                                      DADS TRL file - Processing log    S mast:HST/product/z2za0102t_trl.fits     PUBLIC
        spectrum z2za0102t                           DADS ULF file - Data log GHRS/FOS/FOC/HSP    S mast:HST/product/z2za0102t_ulf.fits     PUBLIC
        spectrum z2za0102t                           DADS D1F file - Raw exposure GHRS/FOS/HSP    S mast:HST/product/z2za0102t_d1f.fits     PUBLIC

# Download only the science products
manifest = Observations.download_products(data_products_by_obs, productType="SCIENCE")
Downloading URL https://mast.stsci.edu/api/v0.1/Download/file?uri=mast:HST/product/z2u91502t_d0f.fits to ./mastDownload/HST/z2u91502t/z2u91502t_d0f.fits ...
|================================================================================================================|  57k/ 57k (100.00%)         0s
Downloading URL https://mast.stsci.edu/api/v0.1/Download/file?uri=mast:HST/product/z2za0102t_d1f.fits to ./mastDownload/HST/z2za0102t/z2za0102t_d1f.fits ...
|================================================================================================================|  14k/ 14k (100.00%)         0s
You will need to have a look at the Data Reduction Handbooks for the particular instruments you want to use to understand the types and format of the data but hopefully this will provide basics to get things started.
