2
$\begingroup$

I have some trouble to find which spectral lines are the ones in this SNR N49 fitted spectrum. X-ray spectrum
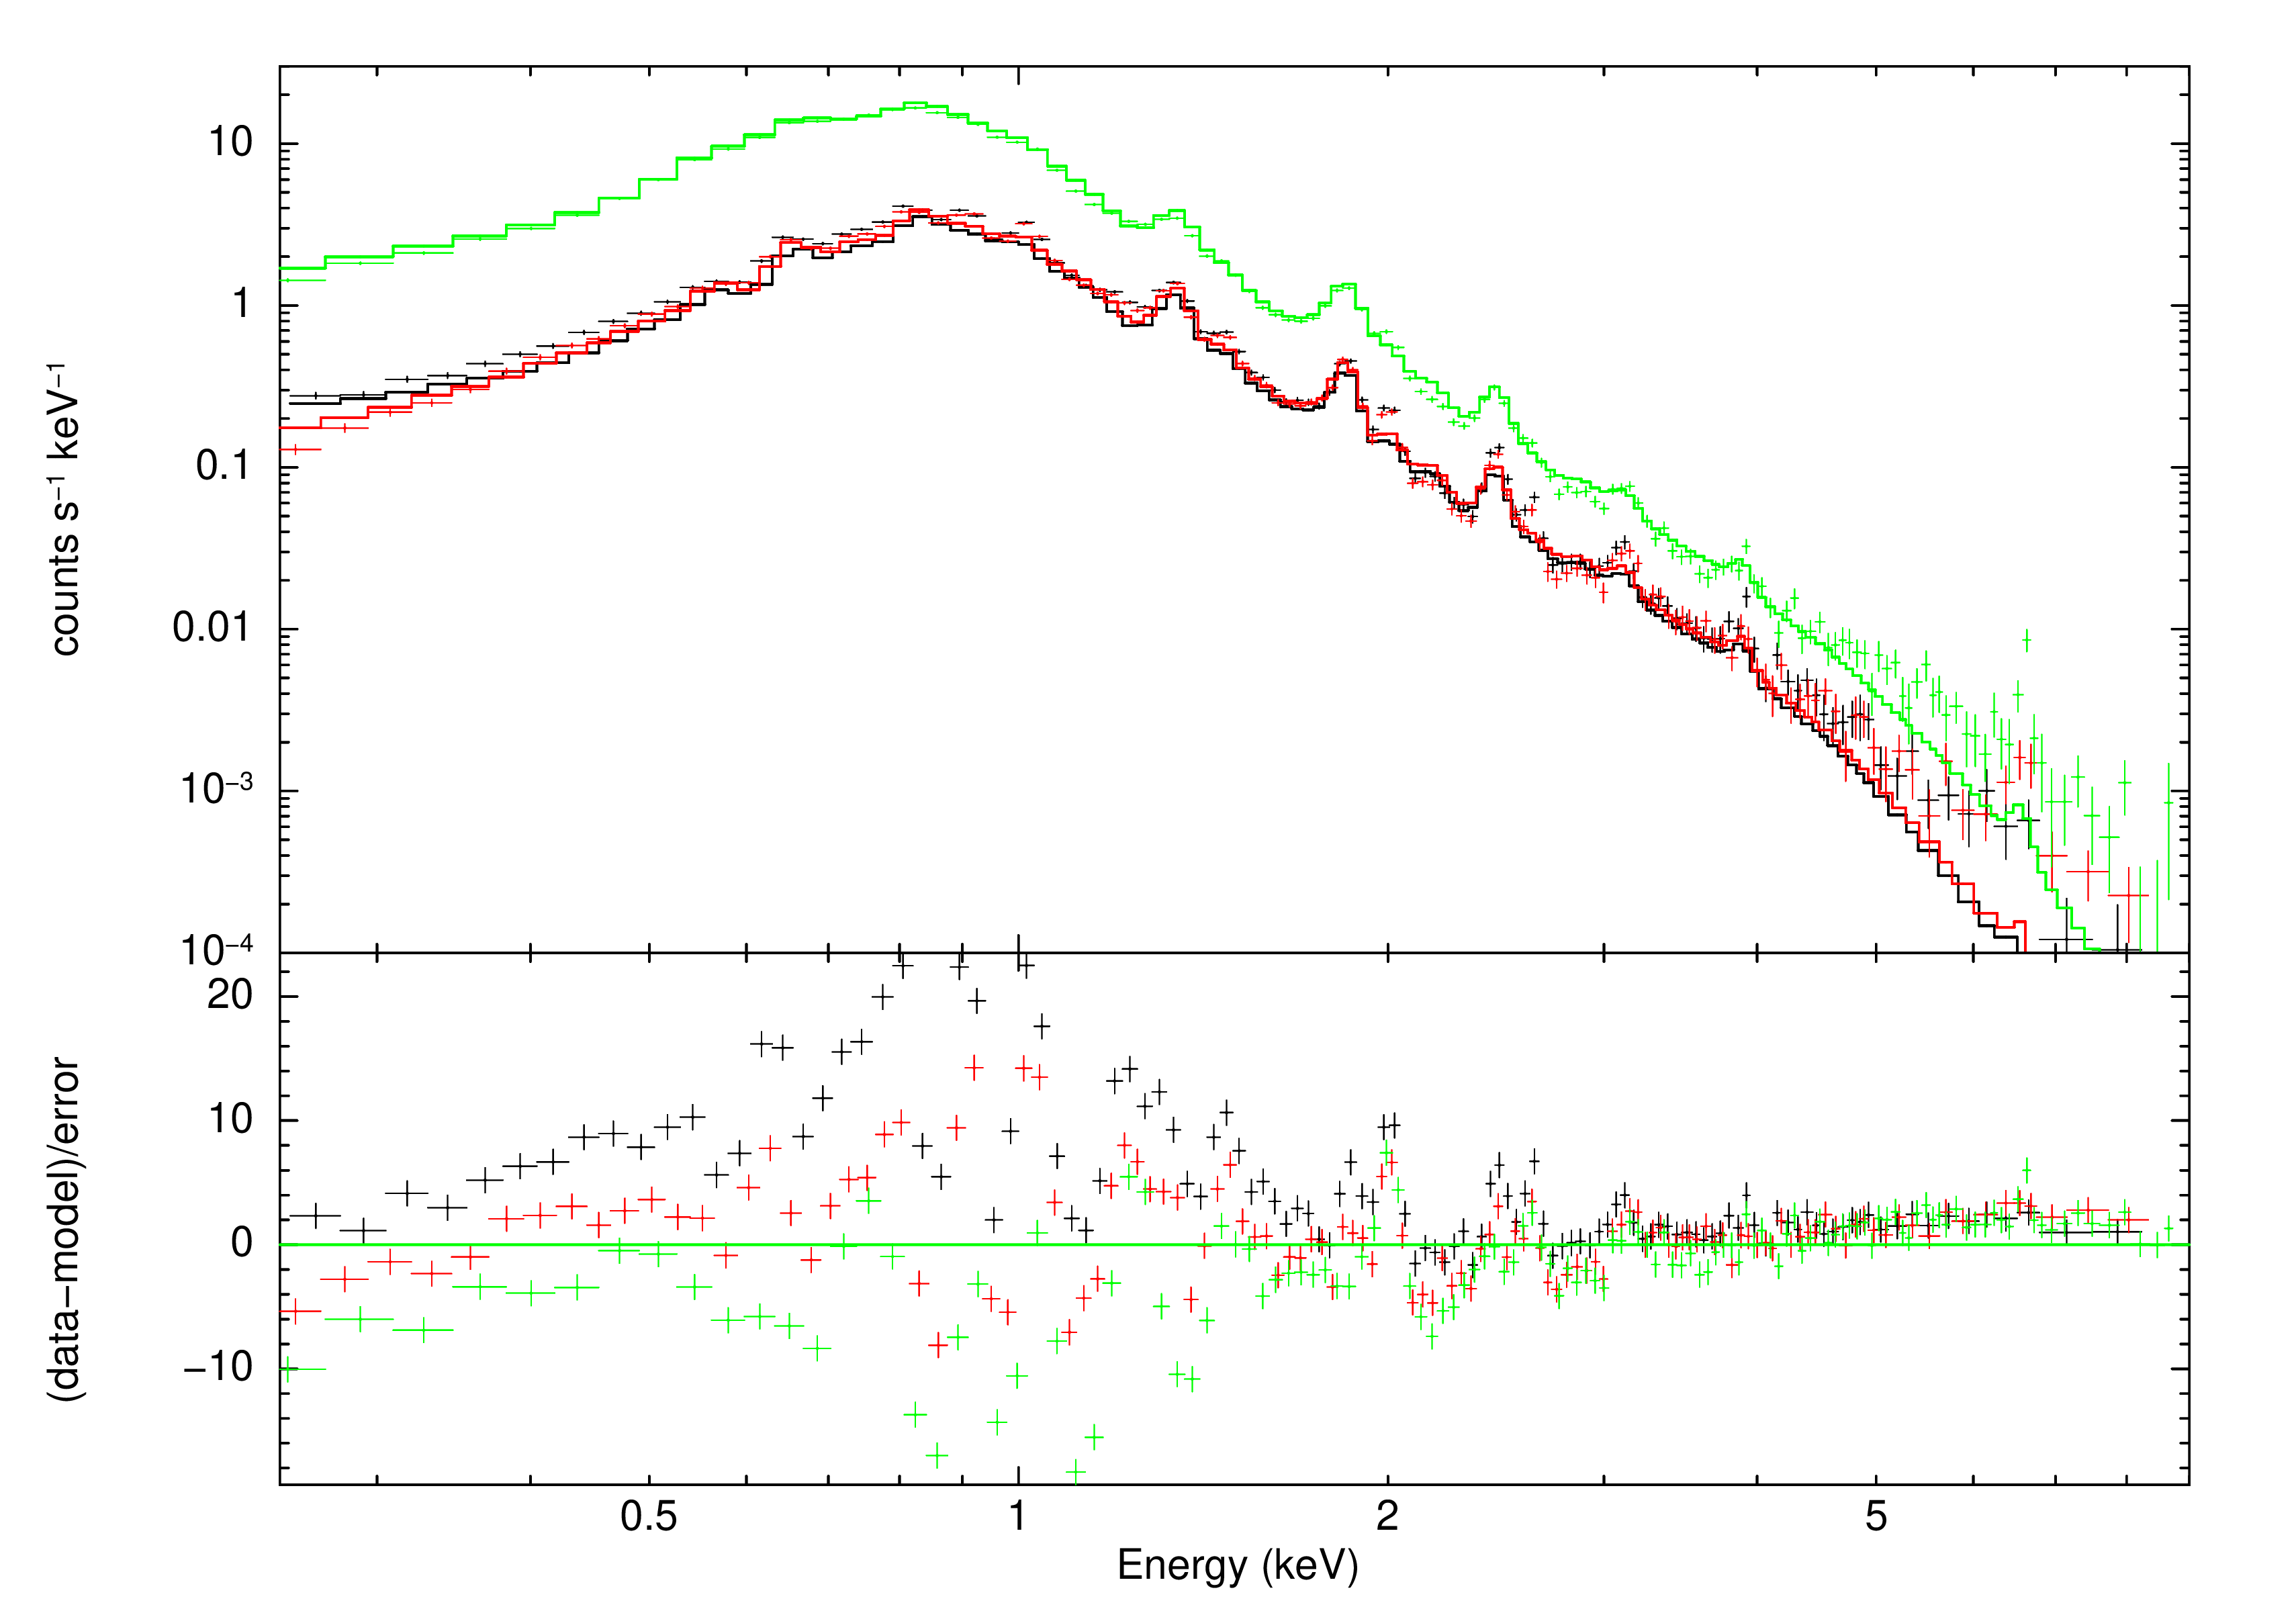
They are at 1.3 keV, 1.9keV, 2.5keV, 3.2keV, 3.95keV and maybe at 0.65keV and 6.8keV (approximately).

They could be H, He, C, O, N, Ne, Mg, Al, Fe, Si, S, Ar, Ca, Ni.

$\endgroup$
3
  • 1
    $\begingroup$ Currently I don't understand this question... as there actually is no question. You want us to analyse the spectrum with the boundaries you give? What is your own take? Be much more verbose. Show us what you tried, and why and where your attempts are unsatisfactorily to you. $\endgroup$ Commented Mar 7, 2023 at 17:16
  • $\begingroup$ I searched on Google but didn't find where to see the energies for that elements. My question is if any of.those elements is visible as a spectral line $\endgroup$ Commented Mar 7, 2023 at 21:22
  • $\begingroup$ I used the website AtomDB, but there are very similar for example the Fe and Mg and Ni. $\endgroup$ Commented Mar 7, 2023 at 23:03

2 Answers 2

7
$\begingroup$

I would go to the AtomDB and then look for lines with high emissivity in a specific wavelength region.

So under "List lines in wavelength region:" select a not too wide energy band and play with the "Min. Emissivity" to not be bombarded by lines.

Additionally it is worth checking out what has been seen in similar sources. For example, you can find the spectrum of Cas A either on this website, which also has a list of most important SNR lines, or in this paper, which shows a very similar set of lines compared to your plot:

enter image description here

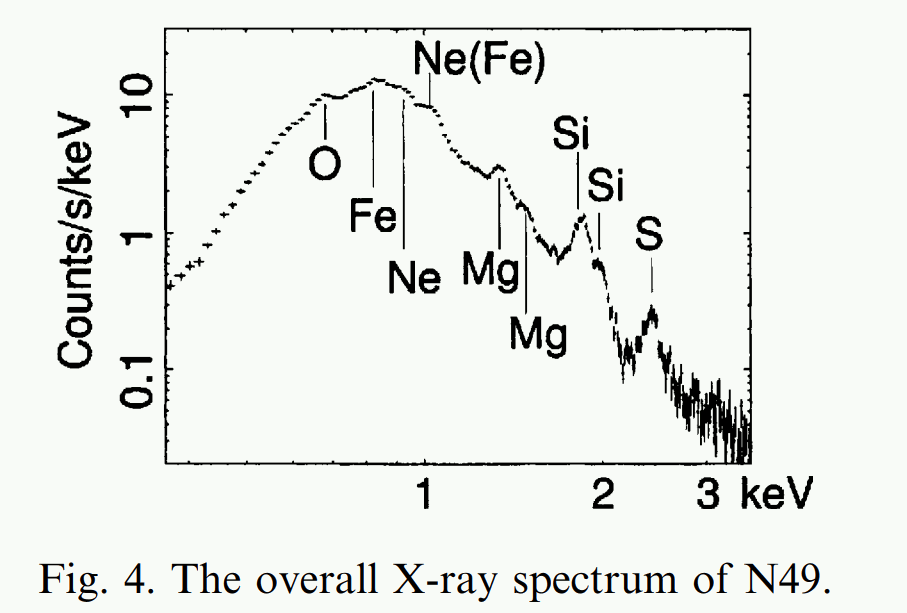
And you are even so lucky that there are previous observations of your source that do identify some of the lines you see:

enter image description here

What also might help you, is to calculate the precise line energy and uncertainty through your fit, so that you can judge whether a literature value would be in agreement with our measured line energy.

With that you should be able to identify your lines.

$\endgroup$
4
$\begingroup$

In addition to AtomDB, another useful resource is the x-ray data booklet provided by LBNL. Specifically, this table has some common x-ray emission lines. My recommendation would be to fit the spectrum to a power law plus some lines with proper initial guesses for the energy. Then look up the best fit central energy, particularly in the K-shell column.

Some possibilities for your lines: 1.3 -> Mg

1.9 -> Si (at 1.7 keV)

2.5 -> S (at 2.3 keV)

3.2 -> K

4.0 -> ?

0.65 -> Good luck. Most x-ray telescopes don't have the resolution to distinguish these low energy lines, and contamination by the solar wind charge exchange is a likely suspect

6.8 -> probably Fe at 6.5 keV

$\endgroup$

You must log in to answer this question.

Not the answer you're looking for? Browse other questions tagged .