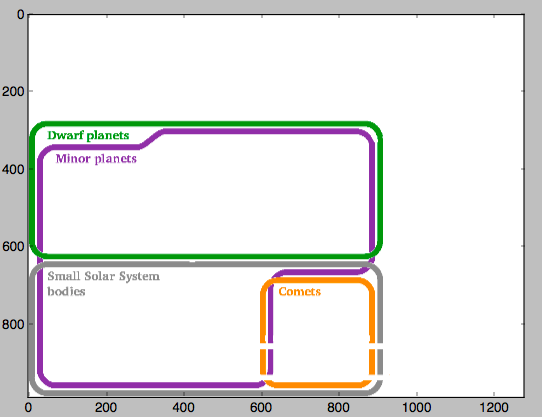
This is supplemental information to further clarify the answer. The drawing is confusing to me an likely to others. I've written a color filter in Python to help isolate only four of the boundaries.

import numpy as np
import matplotlib.pyplot as plt

colorz = dict()

colorz['red']    = 1.0,   0.0,   0.0
colorz['green']  = 0.0,   0.502, 0.0
colorz['blue']   = 0.0,   0.0,   1.0
colorz['purple'] = 0.435, 0.192, 0.596
colorz['brown']  = 0.612, 0.353, 0.235
colorz['pink']   = 1.0,   0.0,   1.0
colorz['gray']   = 0.471, 0.471, 0.471
colorz['orange'] = 1.0,   0.494, 0.0
colorz['yellow'] = 1.0,   0.8,   0.0

namez = dict()

namez['red']    = "Satellites (natural)"
namez['green']  = "Dwarf planets"
namez['blue']   = "Planets"
namez['purple'] = "Minor planets"
namez['brown']  = "Trans-Neptunian Objects"
namez['pink']   = "Planetoiods"
namez['gray']   = "Small Solar System bodies"
namez['orange'] = "Comets"
namez['yellow'] = "Centaurs"

fname = "Euler_diagram_of_solar_system_bodies.svg.png"

img = plt.imread(fname)

def fakeimg(img, colors, hw):

    img3 = img[..., :3]

    imgnew = np.ones_like(img3)

    for color in colors:

        col = np.array(color)[:3]

        mask = (np.abs(img3-col) < hw).all(axis=-1)

        imgnew[mask] = col

    return imgnew

cs = [colorz[c] for c in ['orange', 'green', 'purple', 'gray']]

imnew = fakeimg(img, cs, 0.01)

if 1 == 1:
    plt.figure()
    plt.imshow(imnew)
    plt.show()


