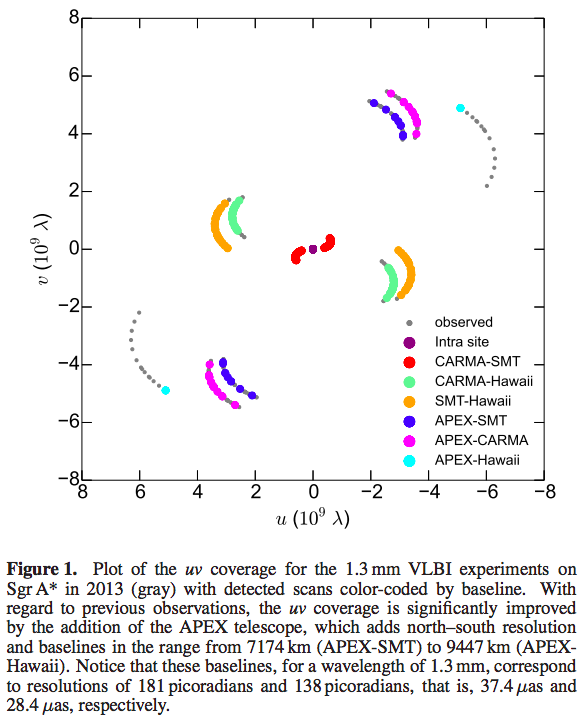
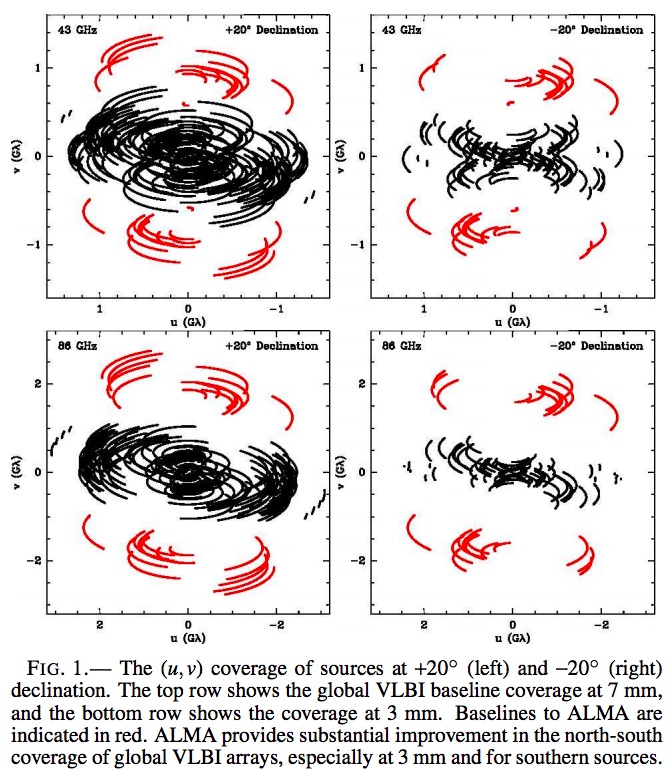
I've seen standard uv plots used discussions of interferometric array designs regularly, and I have a vague idea that each arc may correspond to a pair of elements within the array, and the coordinates $u, v$ in the plot may be something like the path length difference between the source and the two elements projected into some cartesian coordinates, and that the length of the arcs corresponds to the total duration of the observation, but it's all still fuzzy.
Since the elements may be on topography or be so far apart (as in the example below) that the curvature of the Earth is even larger, the formal definition of the $uv$ plane should take this into consideration.
There are several more examples of uv plots and comparisons to point spread functions in the SlidePlayer presentation Array Design and Simulations.
Question: What is the math behind the construction of $uv$ plots in radio astronomy? A source that explains it and shows how one can construct them would be extremely helpful, as will any intuitive hints.
below: From the recent ArXiv preprint Detection of Intrinsic Source Structure at ~3 Schwarzschild Radii with Millimeter-VLBI Observations of Sagittarius A* (also ApJ Open Access.
below: From the 2016 ArXiv preprint High-Angular-Resolution and High-Sensitivity Science Enabled by Beamformed ALMA

