8
$\begingroup$

This question asks about an algorithm used in Project DAMIT.

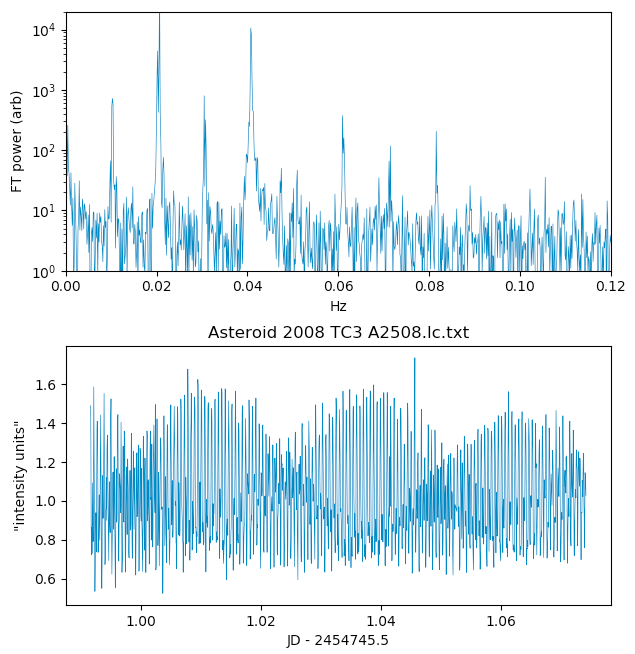
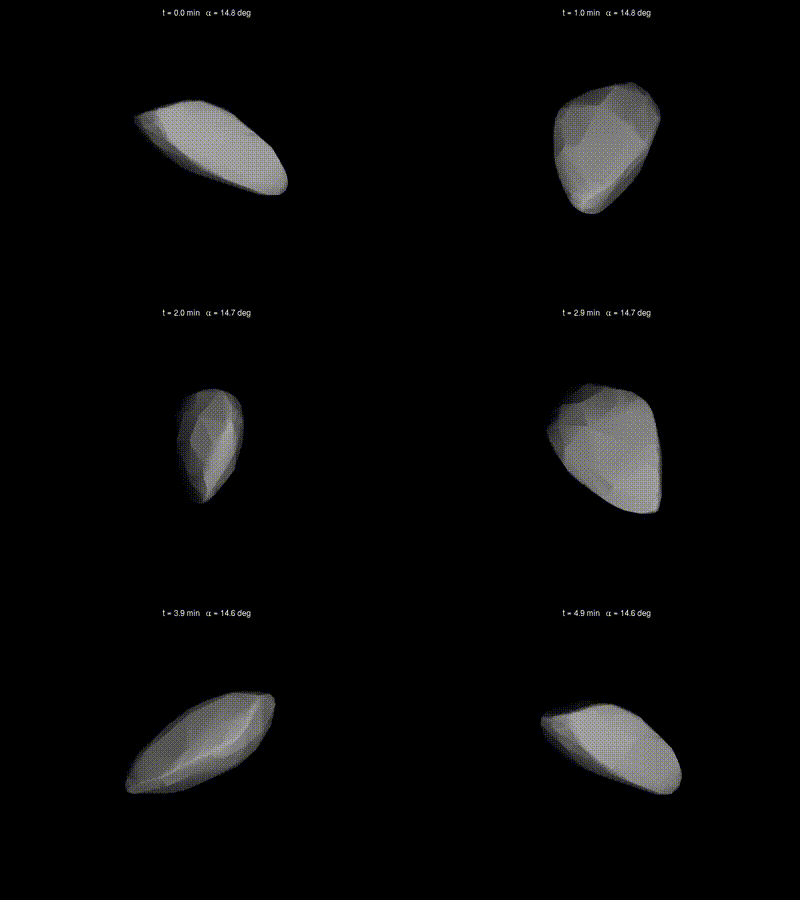
@RobJeffries' answer led me to Wikipedia's William Herschel Telescope which led me to Wikipedia's 2008 TC3 which led me to the animation 2008 TC3 Tumbling (reduced).gif which led me to https://astro.troja.mff.cuni.cz/projects/damit/asteroids/view/2508 where I see two pages listed for light curve data. I've plotted them below.

The web site says that the reconstruction of the shape and tumbling of the asteroid is done as described in their documentation page:

DAMIT asteroid models

DAMIT contains asteroid models that were derived using the light-curve inversion method developed by Kaasalainen & Torppa (2001) and Kaasalainen et al. (2001), combined with other inversion techniques in some cases. Each model in DAMIT references the original paper(s) where it was published. Please note that the models presented in DAMIT may differ from those published in the original papers. The main reason for this is a limited dataset used in the original publication and/or a narrow range of periods scanned during the inversion.

Question: As both parts of the paper are paywalled in Icarus is it possible to generate a straightforward description of the basic idea behind how this reconstruction process generates a shape from an $I(t)$ plot?

For delay-doppler radar observations there is a rich set of data available, but here there is only intensity vs time. How can a 3D shape be unambiguously determined from what looks like a pretty chaotic set of data?

I plotted the data just for kicks.

DAMIT Asteroid 2008 TC3 A2508.lc.txt

https://en.wikipedia.org/wiki/File:2008_TC3_Tumbling_(reduced).gif

Source

$\endgroup$
4
  • 3
    $\begingroup$ It almost certainly cannot be unambiguously determined from a single dataset. But I would think the light curve evolves with different viewing angle, and that ought to do it. $\endgroup$
    – ProfRob
    Commented Dec 24, 2020 at 5:26
  • 3
    $\begingroup$ The abstract of the second paper says "Simulations and real data indicate that the result obtained with convex inversion is unique and stable if several lightcurves obtained at various geometries are available." $\endgroup$
    – ProfRob
    Commented Dec 24, 2020 at 5:37
  • 4
    $\begingroup$ +1 for DAMIT in the title and wonderful question! $\endgroup$
    – DialFrost
    Commented Oct 15, 2022 at 2:59
  • $\begingroup$ Nice use of a Cobra ship model! $\endgroup$
    – Rory Alsop
    Commented Oct 17, 2022 at 12:58

2 Answers 2

3
+50
$\begingroup$

Your question consists of two sub questions:

  1. How do they get the 3d shape of an asteroid?
  2. How do they get the rotational trajectory of an asteroid?

A paper on The representation of asteroid shapes: a test for the inversion of Gaia photometry comprehensively answers the second! This other paper on Asteroid models reconstructed from the Lowell Photometric Database and WISE data will explain the first question.

Let's answer the first question.

...

Let's answer the second question.

Abstract:

We have implemented numerical procedures for comparing ellipsoids to more complex and irregular shapes, and we performed a full simulation of the photometric signal from these objects, using both shape representations. Implementing the same software algorithm that will be used for the analysis of Gaia asteroid photometry, rotation period, spin axis orientation and ellipsoidal shape were derived from simulated observations of selected Main Belt asteroids assuming a geometric scattering model (work is in progress for more complex scattering models). Finally, these simulated Gaia results were compared to check the relevance of the ellipsoidal solution in comparison to multi-parametric shapes. We found that the ellipsoids by photometry inversion are closely similar to the best-fitting ellipsoids of the simulated complex shapes and that the error on the asteroid volume (relative to a complex shape) is generally low, usually around 10%.

The main question this paper plans to answer (and yours too!) is:

The Gaia data will provide an excellent opportunity to expand the database of the known basic physical properties of asteroids, but how accurate will the approximation be?

In short:

In order to provide an answer to the previous question, we simulated the whole observational process, from the generation of synthetic photometric fluxes to the light curve computation, by a dedicated pipeline called “Runvisual” (developed in the C-language), specifically implemented to assess the expected performance of the asteroid photometry inversion. For the generation of fluxes, we described the objects as multi-parametric 3D-shapes represented by triangular elementary facets. In the following we refer to them as “complex models”. The asteroid complex models are used to:

(a) Compute the best-fit ellipsoidal models of the assumed complex shapes (see later)

(b) Generate Gaia synthetic photometric observations.

The computation of a best-ellipsoid fit i.e. point (a) is a process taking place in two steps:

  1. Calculation of the major axis and of the intermediate axis of the ellipsoid in the asteroid X-Y plane as best-fit ellipse

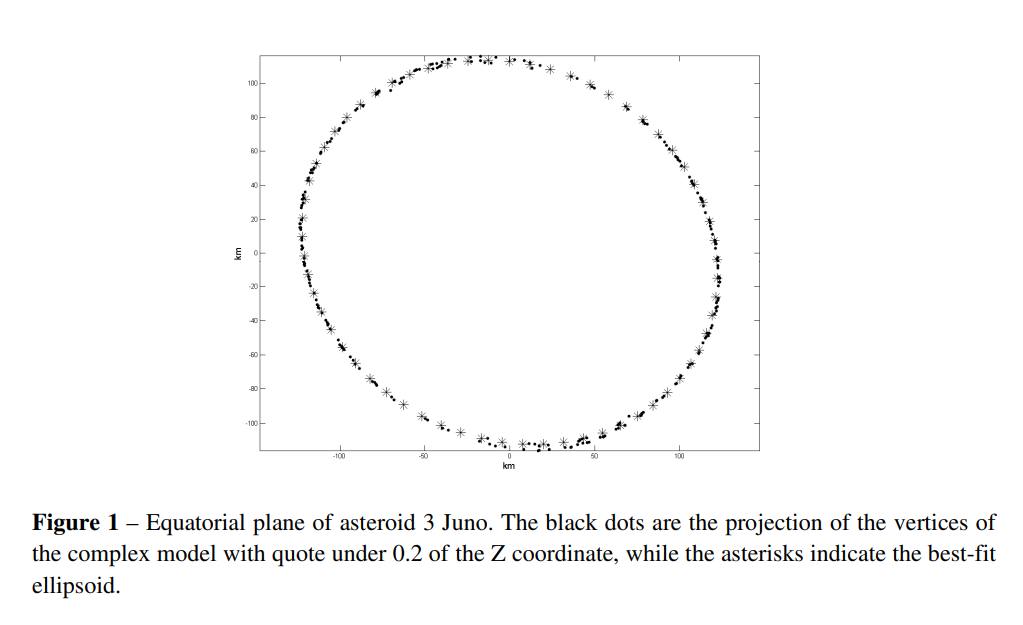
An example is Figure 1:

enter image description here

Description:

To this purpose we compute the average points from the vertices points of the asteroid profile (i.e. the points that fall within a small distance from the X-Y plane in a certain azimuth interval), in order to avoid accumulation of points along the profile in the plane. In this way, no regions of the asteroid weigh more than others and none could alter the position of the best-fit ellipse. With the angular averaged data we can compute the mean of the X and Y coordinates that can be assumed as a guess of the center of the ellipse. With the same averaged points, a guess is made of the semi-major, semi-minor axis and inclination of the ellipse. Finally we find the ellipse parameters for which the Root Mean Square (RMS) is minimal. The RMS is the algebraic distance of the observed points from the equation of the canonical ellipse.

  1. Compute the third ellipsoid axis along the Z-axis by imposing that the volumes derived from both the complex and the ellipsoidal shape are equivalent

In this way, by construction, the equatorial plane and the spin of the best-ellipsoidal shape are the same as the complex shape. The best-ellipsoidal shape thus obtained is taken as reference for comparison with the ellipsoid obtained by inversion of the simulated Gaia asteroid photometry. The dates of Gaia observations have been simulated using software written by F. Mignard and P. Tanga and implemented in the Java computer language by Christophe Ordenovic (Observatoire de la Côte d’Azur). The software simulates the Gaia observation sequence for any Solar System object, providing for each observation the corresponding Gaia-centric and heliocentric distance and phase angle.

Results:

In general, the values of the rotation periods of the genetic ellipsoids are identical to those of the complex models (the rotation period was precise within 10-4-10-5 hours), the only exception is the period of 3 Juno, which result twice of the real value. Our results suggest also that the “genetically derived” ellipsoids found by photometry inversion closely resemble the best-fitting ellipsoids of the complex shapes. The axial ratios between the genetic inversion and the best-ellipsoidal models (in geometric scattering model) are b/a = 0.94 ± 0.06 and c/a = 0.95 ± 0.09, while the spin coordinates difference, in ecliptic longitude and latitude, between the genetic inversion and the complex or best ellipsoidal models are ∆λ = 2 ± 1° and ∆β = 3 ± 8° (see Fig. 3 and 4). The only great exception is for the spin longitude of 584 Semiramis, where there is a difference of about 180° compared to the real value. In any case the spin solution is unique, i.e. there are no cases in which two spin values are compatible with the observations. We note also that, according to Torppa et al. (2008), the overall difference (RMS) between complex and best-ellipsoidal model is not very important for a good pole fit, confirming similar results by Cellino et al., (2009).

$\endgroup$
2
  • $\begingroup$ Every few years I loose track of a bounty and it is auto-awarded by an SE bot. In that case the amount awarded is half which explains the +50. $\endgroup$
    – uhoh
    Commented Oct 23, 2022 at 2:11
  • $\begingroup$ @uhoh isok, as long as it answers your question! :3 (I'll continue editing) $\endgroup$
    – DialFrost
    Commented Oct 23, 2022 at 3:10
1
$\begingroup$

In a word… vaguely. The question of asteroid shape (even “hull,” or convexities only) is well-posed but still requires a significant amount of assumption to get “from here to there.” Hence, some asteroid models turn out to be pretty good in hindsight, and some turn out to be horrendous:

Lowry, S. et al. Dec. 2012 “The nucleus of Comet 67P/Churyumov-Gerasimenko. A new shape model and thermophysical analysis“ A & A 548, 12

Harris, A., Warner, B. 2018 "Asteroid lightcurves: can't tell a contact binary from a brick" AAS DPS Meeting, #414.03

In the immediate sense, taking a lightcurve gets you a rotation period… maybe. A non-sphere changes its reflection of sunlight twice per period, or perhaps four times if it’s aspheric but in a symmetric way (ambiguous Fourier solution). Hence it’s fairly easy to speak of a body’s aspect ratio (long dimension versus short dimension). But even that assumes no albedo features (bright or dark areas, messing with the lightcurve). Assuming flat reflectivity, this shape model is some egg shape, or possibly tangerine: aspheric in one dimension only.

On a longer timescale, space is inertial and the body’s rotation state is stable. (…Except when it isn’t: chaotic rotation or ‘tumbling.’) Over one orbit, the rotation axis will make one pivot about the sky. This additional period (plus the viewer’s state, on Earth) then gives a second curve, superimposed on the first. Deconvolving this second function gives some indication of the pole orientation… unless it doesn’t. Pole solutions often give a second (…first?) eigenvalue. The process continues, deriving a second-order aspect ratio which (may) give a second aspect ratio, for three lengths: the body’s a:b:c dimensions, expressed as ratios. This shape model then goes from egg, to mango or sunflower seed or similar.

Of course, nothing says the first or second lightcurves will be true sinusoids. Deviations from smooth sine waves are deviations from ellipsoidal profiles… except when they’re not. The higher-term irregularities may be local features like craters or such… or again, albedo differences.

And this is all glossing over instrumental effects and irreproducibilities- two observer groups will have two optical trains, with two profiles of detector noise and atmospheric ripple. Ultimately, we’d like a net lightcurve patched from an ensemble of corroborating results. The shape model, too, may have different groups doing their own deconvolutions. If the shape is reproducible enough between reviewers/follow-up work, we feel satisfied… until, of course, that rare Rosetta moment pulls the rug out. Fortunately, asteroids do have some gravity, and an asteroid big enough to draw study is usually big enough to not have reentrant forms like Churyumov-Gerasimenko.

If we’re lucky there will be a good, radar-worthy apparition while Goldstone, etc. is open. Then a range-dopplergram gives a second model, for comparison. Alternately, an occultation campaign may be able to put three or more chords across the body profile. If nontrivially placed, multiple chords constrain a profile to certain (convex) shapes, not others.
$\endgroup$
1
  • $\begingroup$ "...can't tell a contact binary from a brick" :-) $\endgroup$
    – uhoh
    Commented Oct 18, 2022 at 0:08

You must log in to answer this question.

Not the answer you're looking for? Browse other questions tagged .