2
$\begingroup$

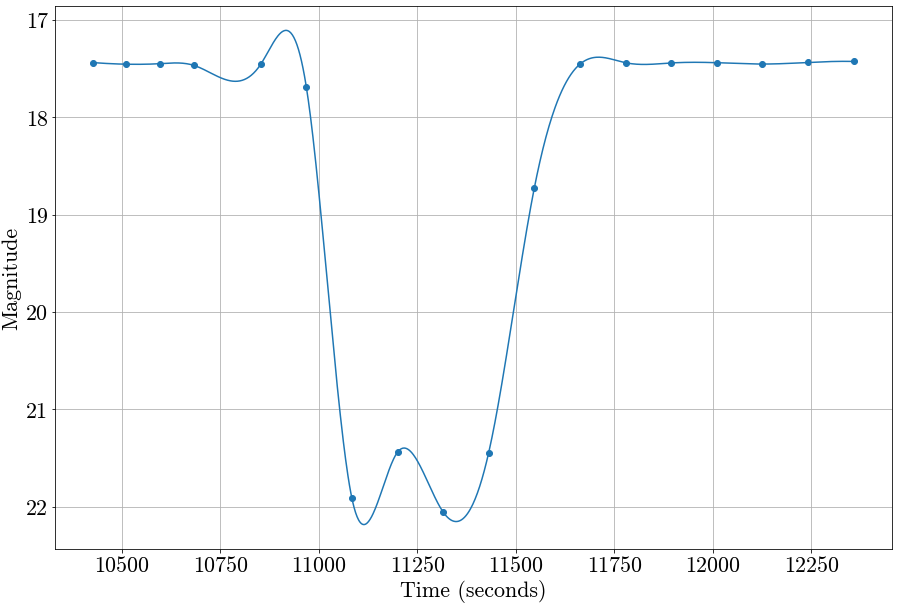
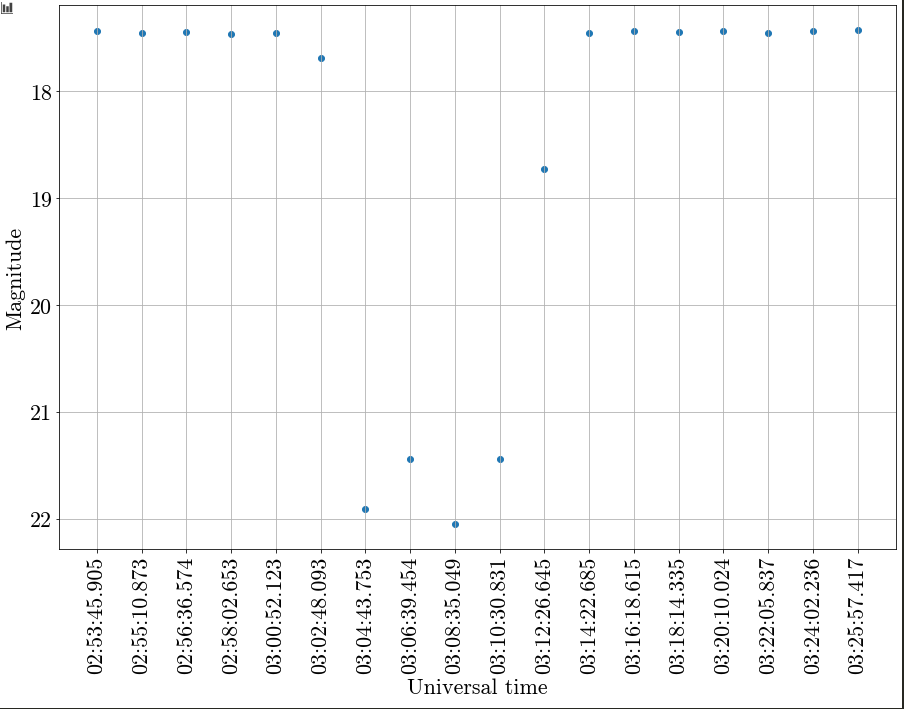
I am creating a light curve for the duration of a binary system in order to find out the duration of the eclipse. I am unsure as to whether to fit a function to the data (is it appropriate) as by fitting the function I am expressing that I think that the data lies within this region.

I was thinking of maybe doing the fit piecewise but I am unsure if I should even fit it at all. Any reading material or help would be great. I just need a pointer in the right direction.

I've attached two images. One plot without a fit and one plot with a cubic function fitted to the graph.

Many thanks in advance, Owen.
enter image description here

enter image description here

$\endgroup$
3
  • 1
    $\begingroup$ It would be better if you try fitting a periodic function to graph the light curve. $\endgroup$
    – WarpPrime
    Commented Jan 6, 2021 at 17:29
  • 3
    $\begingroup$ You need to use error bars to show the accuracy of the measurements. What a "reasonable" fit would be is hard to gauge without knowing the measurement error ranges. $\endgroup$ Commented Jan 7, 2021 at 3:17
  • $\begingroup$ Thank you for your response. That helps. I will also try to repost with errors. $\endgroup$ Commented Jan 7, 2021 at 18:08

0

You must log in to answer this question.

Browse other questions tagged .