6
$\begingroup$

This paper shows that there is a dip in the CO2 absorption spectrum of Earth. In essence the trough of the absorption of CO2 for Earth is cut into two separate troughs instead of 1 large trough. Why is that?

Thermal emission spectra recorded by IRIS-D on Nimbus 4. The apodized spectra have a spectral resolution between 2.8 cm−1 and 3 cm−1. A hot desert case, an intermediate case over water, and an extremely cold spectrum recorded over the Antarctic are shown. Radiances of blackbodies at several temperatures are superimposed.

original without arrow

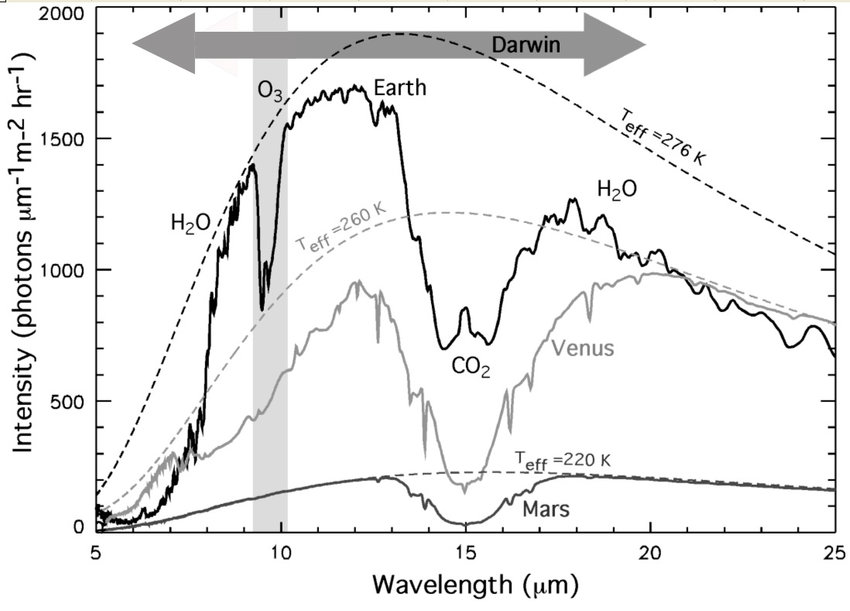
As there have been some comments on whether this is planet related or molecule related, here is an additional image which shows the absence of the double trough in the CO2 absorption pattern for Venus whilst showing it for Earth: The mid-IR spectrum of the Earth, Venus and Mars at a low resolution (spectra are derived from a variety of published models including Meadows and Crisp, 1996; Tinetti et al., 2005; Tinetti et al., 2006; Kaltenegger et al., 2007; Selsis et al., 2007b).

$\endgroup$
13
  • 2
    $\begingroup$ Can you explain where that linked paper shows that? I haven't thoroughly studied it yet... but it's not immediately apparent to me that it does make that claim $\endgroup$ Commented Apr 13, 2021 at 10:34
  • 3
    $\begingroup$ Thanks for the update with graphs. I don't know the answer but can ask questions: is the resolution of the Venus spectrum good enough to show the same peak? Would pressure broadening due to the different atmospheric conditions sufice to make it vanish in Venus's spectrum? $\endgroup$ Commented Apr 13, 2021 at 11:14
  • 2
    $\begingroup$ ncbi.nlm.nih.gov/pmc/articles/PMC6174548 might help. There is no requirement that absorption be continuous, since potential absorbing transitions are not continuous $\endgroup$
    – Jon Custer
    Commented Apr 13, 2021 at 13:58
  • 1
    $\begingroup$ @a.t. I've added an annotated version of your plot, is that the region that you speak of? These are radiance (brightness) plots you ask about the absorption spectrum, so I think by "cut in two" you mean the narrow "spike" of higher radiance right in the middle of the broad, low area, right? $\endgroup$
    – uhoh
    Commented Apr 13, 2021 at 15:49
  • 2
    $\begingroup$ This question really is a good example that it evolved over time and in response to the comments to become a much better and clearer asked / focused question - and a very interesting and deep one at that. $\endgroup$ Commented Apr 14, 2021 at 14:27

2 Answers 2

7
$\begingroup$

Eric Jensen has already provided a nice link to a description of the basic structure of the ${\rm CO}_{2}$ spectrum, so I'll focus on the question of why there's a "spike" at 15.0 microns in the Earth spectrum, but not in the Venus or Mars spectra.

If you look at the link in Eric's answer, the very first image shows a high-resolution version of the ${\rm CO}_{2}$ absorption spectrum, including the main features to the right and left. There is also a very strong absorption peak in the middle (the "Q-branch") at about 15.0 microns (667 ${\rm cm}^{-1}$ in wavenumbers). The question then becomes: why does this feature show up as an extra dip in the Venus spectrum (and, barely visible, in the Mars spectrum) -- as one might expect -- but apparently as a peak in the Earth spectra?

The answer hinges on the fact that the spectra shown in the question are not, strictly speaking, absorption spectra. They are actually radiance/intensity measurements of infrared light emitted by different layers in the atmosphere of the planet in question, as seen from orbiting spacecraft. (In the first figure, it's narrowed to the atmosphere above certain locations on the Earth.) They thus show a combination of the molecular absorption spectra and the temperature structure of the atmosphere.

In simple terms, the spectra show thermal (blackbody) emission from layers in the atmosphere where upward-going photons can escape to space without being absorbed by higher layers in the atmosphere. The altitude of these layers is determined by the amount of the absorbing gas (e.g., ${\rm CO}_{2}$) and the strength of the absorption at a given wavelength. The stronger the absorption, the higher up is the layer that can emit freely to space.

(Note that for wavelengths with effectively zero absorption from any molecule, the "emitting layer" is actually the surface of the planet.)

How much infrared light is emitted at a given wavelength then depends on the temperature of the emitting layer, and it is here that the vertical temperature structure of the atmosphere becomes important. For Venus and Mars -- and for most of the emitting altitudes for Earth -- the temperature decreases with altitude, so that higher emitting layers have lower temperatures and thus emit less radiation. The net effect is to reproduce the absorption features, even though the whole thing is not, technically, an absorption spectrum.

But in the case of the Earth, the strongest absorption -- e.g., in the Q-branch part of the ${\rm CO}_{2}$ absorption, at 15.0 microns -- forces an emitting altitude that is so high it is actually in the stratosphere. And in the stratosphere, the temperature increases with altitude. So the Q-branch absorption peak forces the emitting layer to be at a higher temperature than is the case for the rest of the ${\rm CO}_{2}$ absorption regime.

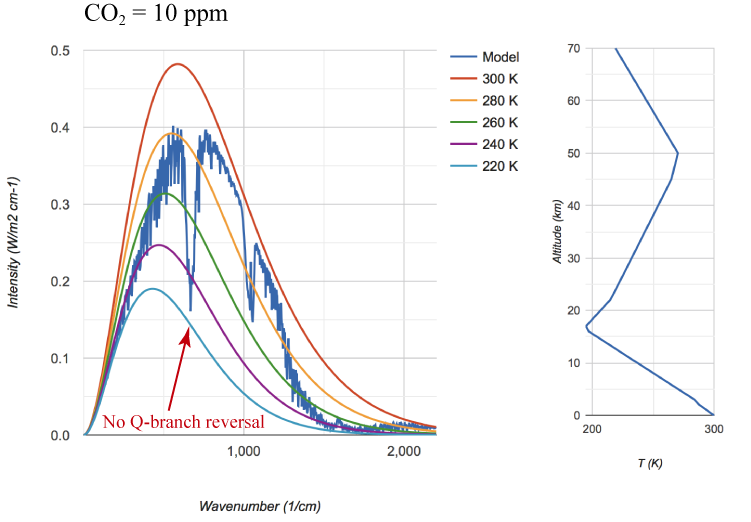
This University of Chicago MODTRAN web page, which plots predicted emission from the Earth's atmosphere as seen from an altitude of 70 km (default setting), shows this rather nicely. The default parameters include a modern ${\rm CO}_{2}$ concentration of 400 ppm, which gives the feature seen in the Earth observations (i.e., the local emission peak in the middle of the 15 micron trough, which I've labeled "Q-branch reversal"):

enter image description here

But if you dial the ${\rm CO}_{2}$ concentration way down (e.g., to 10 ppm), the emitting altitudes are lower for all ${\rm CO}_{2}$-absorbing wavelenths, so much so that the emitting altitude for the Q-branch is down below the stratosphere, and so is at a lower temperature than the rest, and thus emits less flux, giving you the expected profile (i.e., with the weakest emission at the Q-branch wavelength, instead of a reversal):
enter image description here

(Finally, I believe the peculiar spectrum for the "Antarctic" case in the first figure is due to the unusual temperature profile of atmosphere in arctic regions, which includes the temperature increasing with altitude in the first few km above the ground; the fact that the interior of Antarctica is high altitude might also be relevant.)
$\endgroup$
6
  • $\begingroup$ I came here to comment but found your detailed answer. Which I do upvote. My original intent was to point out - with no details - that the T of Venus can result in spectral broadening itself. This fact alone would let the two sides of the peak merge togheter. Perhaps this my comment is still of relevance and can be added. $\endgroup$
    – Alchimista
    Commented Apr 14, 2021 at 12:46
  • $\begingroup$ @Alchimista If you look at the second figure in the question, it suggests that the mid-IR emission is coming from a rather cold temperature in Venus's atmosphere; at 15 microns, we're not seeing anywhere near the surface of Venus! $\endgroup$ Commented Apr 14, 2021 at 12:54
  • $\begingroup$ Thanks Peter! I knew there was something incomplete there with the central reversal, but couldn’t put my finger on it (and didn’t see the plots for Venus and Mars at the time I posted). Thanks for your excellent answer. You can see the same reversal in the ozone (O3) feature for Earth as well. $\endgroup$ Commented Apr 14, 2021 at 12:56
  • $\begingroup$ Eric -- I thought about mentioning ozone, and I'm pretty sure it's the same thing going on, but since most of the ozone is in the stratosphere, it's a bit harder to think about... $\endgroup$ Commented Apr 14, 2021 at 12:59
  • $\begingroup$ Outstanding answer! Further reading: arxiv.org/abs/2006.03098. Dependence of Earth's Thermal Radiation on Five Most Abundant Greenhouse Gases. The authors run simulations and consider this very spike in "the band of frequencies near the center of the exceptionally strong bending-mode band of CO2 at 667 cm−1. Here doubling CO2 moves the emission heights to higher, warmer altitudes of the stratosphere, where molecules can more efficiently radiate heat to space." $\endgroup$
    – Connor Garcia
    Commented Apr 14, 2021 at 15:16
5
$\begingroup$

This is caused by the internal structure of the CO2 molecule. When a molecule absorbs light, the energy of the photon goes into changing the internal energy of the molecule. Many bands that are strongly absorbing (especially at infrared and radio wavelengths) are related to changes in both the rotational and vibrational energy of the molecule. In this particular band, the vibration is changing from its lowest possible value (the "ground state") to its second-lowest value. The parts of the absorption band to the right are where the rotational energy also increases slightly, and the parts to the left are where it decreases slightly (both by one step, or one rotational quantum number).

There is a more detailed spectrum of that absorption feature in this discussion of CO2 in the atmosphere.

EDIT: This doesn’t fully address the central reversal - I thought initially that it might be explained simply by smoothing the overall absorption linked above to lower resolution, but @Peter Erwin has the correct answer. See Peter’s answer for the correct explanation.

$\endgroup$
2
  • 1
    $\begingroup$ I don't see that this addresses the shape of the spectrum shown in the OP which has an emission reversal in the much broader absorption feature. $\endgroup$
    – ProfRob
    Commented Apr 14, 2021 at 12:47
  • $\begingroup$ Good point - @Peter Erwin has the answer. $\endgroup$ Commented Apr 14, 2021 at 12:51

You must log in to answer this question.

Not the answer you're looking for? Browse other questions tagged .