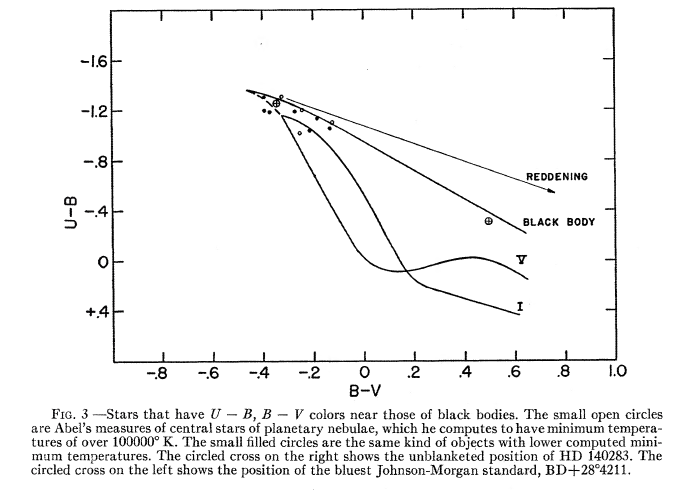
The plot is from this paper (pg-8). 
They have also talked(in the same paper) about how central stars from galactic longitude range $20^\circ-80^\circ$ will have a very unusual Reddening line (pg-9). The current plot is for central stars from the galactic longitude range $200^\circ-300^\circ$
The group of planetary nuclei plotted here are all those occurring in galactic longitudes 200o -300°. In the longitude range from 20° to 80° the points fall to the right of the reddening line in Figure 3 (not plotted). If the latter energy-curves are well-behaved, a very unusual reddening line would be needed to explain their position in the diagram. This is a puzzling result which is unexplained at present.
My interpretation of Reddening line: It is showing that if we plot real star data where the sample contains all the stars from bluer end to redder end on this U-B vs B-V plot, we will get the Reddening line on the plot.
Is this interpretation correct?