11
$\begingroup$

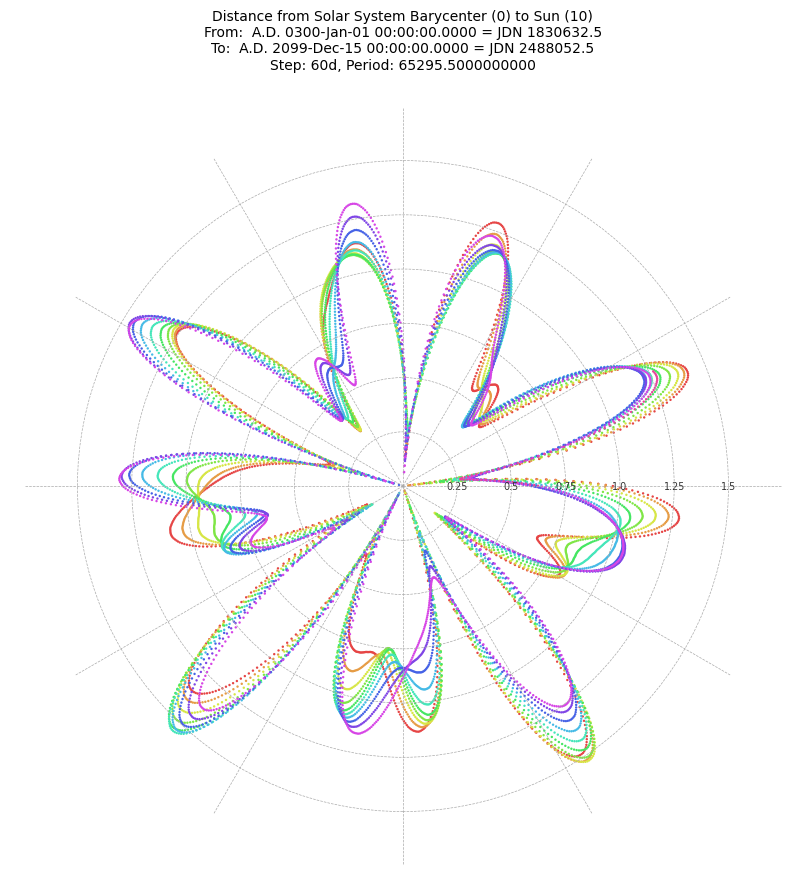
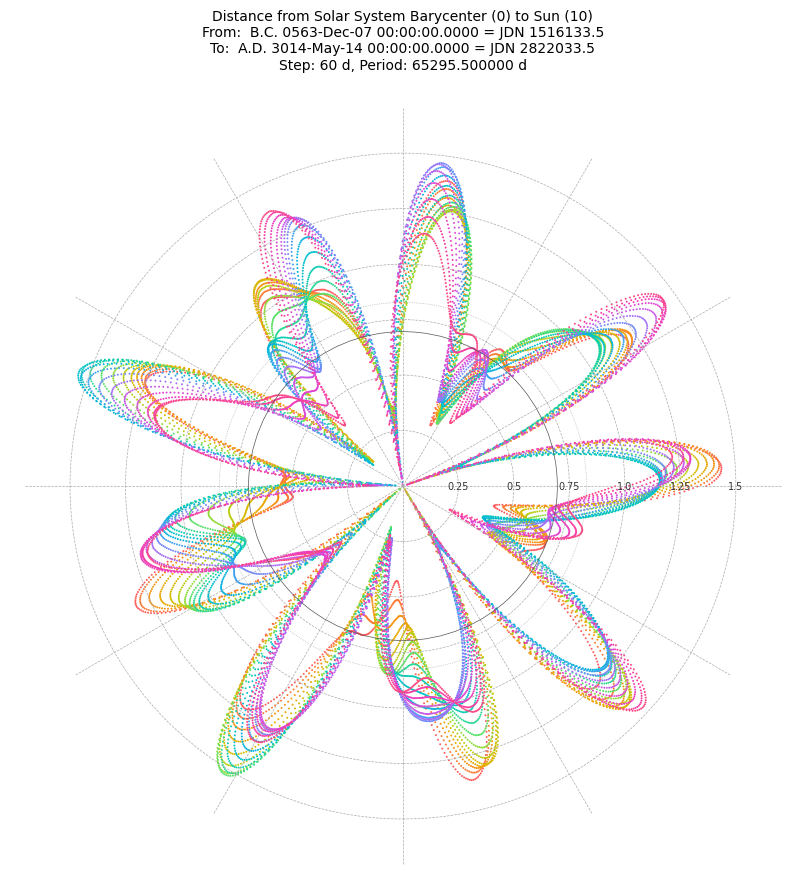
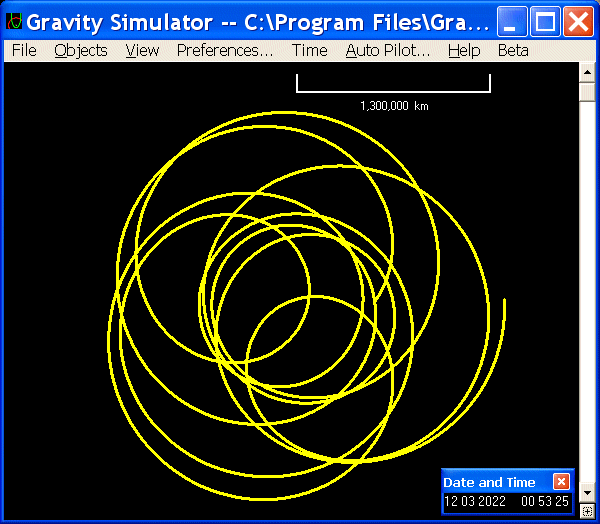
I came across this picture on wikipedia: sun barycenter

Note: From a quick search I gathered that although there are slight differences between the limb of the sun and the accepted radius of the sun, these differences are rather tiny (~330km if I'm interpreting this correctly https://www.aanda.org/articles/aa/full_html/2018/08/aa32159-17/aa32159-17.html ). Thus it seems fair to say that the points on this picture that are beyond the limb are "outside" of the sun, but feel free to correct me if I'm mistaken on this point.

From this picture, it looks like the barycenter is more often than not outside of the sun. Going from the points alone, it looks to be about 60% outside, though perhaps this is not a fair representation. On longer timeframes (lets say 100's of millions of years), is the barycenter of the solar system usually outside of the sun? Or does the possibility of a massive undiscovered object with a highly elliptical orbit make such long term estimation impossible?

$\endgroup$
6
  • 5
    $\begingroup$ You can only define the barycentre in terms of known objects. $\endgroup$
    – ProfRob
    Jul 14, 2021 at 22:16
  • 2
    $\begingroup$ Related, if not a duplicate: Where is the Solar system's barycenter located? $\endgroup$
    – WarpPrime
    Jul 15, 2021 at 1:58
  • $\begingroup$ It is due to Jupiter. Jupiter and the Sun circle around the barycenter. Sedna revolves around the Sun-Jupiter barycenter as well. The hypothetical massive planet would probably do so too. $\endgroup$
    – John
    Jul 15, 2021 at 4:37
  • $\begingroup$ Mostly Jupiter and Saturn but as Section 2.2 of Park et al. 2020 for the new DE440 ephemeris: "Compared to DE430, SSBC (Solar System BaryCenter) has shifted by ~100 km, which is mainly due to the addition of KBOs. (Kuiper Belt Objects)" (italics my acronym expansion) $\endgroup$ Jul 15, 2021 at 16:15
  • 1
    $\begingroup$ Does this answer your question? Where is the Solar system's barycenter located? $\endgroup$
    – Rory Alsop
    Jul 20, 2021 at 8:19

3 Answers 3

12
$\begingroup$

Yes, the Solar System barycentre (SSB) is usually outside of the Sun. That is, over the long term, the mean distance from the centre of the Sun to the SSB is greater than the Sun's radius of 695,700 km. (That's the IAU's nominal solar radius).

As ProfRob commented, we don't really know the exact location of the SSB, since we can only calculate it based on the known bodies in the Solar System, and we simply don't know the locations, trajectories, and masses of all the bodies in the outermost reaches of the system. So we use a nominal SSB with a location consistent with the motions of the known bodies, and that location is updated when new information becomes available.

The Jet Propulsion Laboratory (JPL) have been producing ephemerides since the 1960s. Their JPL Development Ephemeris series is not only used by NASA, it's also been the basis of the Astronomical Almanac since 1981. Their ephemeris data covering 9999 BC to 9999 AD is freely available via the Horizons system. They recently updated their SSB info:

April 12, 2021 Due to the addition of KBO mass in DE440/441, the SSB has shifted about 100 km


A few months ago, I added a link to an interactive 3D version of the Sun-SSB diagram to this answer. I used that Python code as the basis of a new script that creates 2D plots of the radial distance of the centre of the Sun from the SSB for any timespan in the Horizons database. It also integrates the mean radial distance over the selected timespan. Here's an example plot, covering 1700 AD to 2200 AD, with a timestep of 1 calendar year, which yields a mean distance of 829,224 km. A timestep of 1 calendar month gives a mean distance of 829,185 km. That's comfortably larger than 695,700 km.

Sun-Barycentre distance, 1700-2200

The vertical scale is in kilometres, which the plotting library prints in scientific notation, with "1e6" near the top of the axis. The horizontal axis is labelled with Julian day numbers, which are also displayed in scientific notation.

I chose 500 years because it's long enough to include a few orbits of Neptune and it's approximately a whole number of cycles of the 3 outer planets. It's also convenient that it's a whole number of decades. ;)

Planet Cycles
Jupiter 42.15
Saturn 16.95
Uranus 5.95
Neptune 3.03

Here's a live version of the plotting script, running on the SageMathCell server. It has various options (including SVG display) which (I hope) are self-explanatory. The start & stop values must be whole year numbers, possibly with an "AD" or "BC" prefix or suffix (this notation is needed for years before 100 AD). The step parameter has various options, see the Horizons docs for details, but briefly "6 Month" steps by 6 calendar months, "100 days" steps by 100 days, and a plain number without any letters divides the timespan into that number of equal steps.

The script caches the last 3 sets of data fetched from Horizons, so if you just modify "cosmetic" options (without changing the timespan or time step) it can reuse the data rather than having to request the identical data again.

The script doesn't use any Sage features, apart from the plotting routines, so you can use the functions that fetch and parse Horizons data in a standard Python environment. (The code that converts Horizons commands to a URL is much more robust than the code I used in the 3D plot).

Here's an SVG corresponding to that Wikipedia diagram: 1945-1995, with 1 year steps. It has a mean distance of 822,369 km.

Sun-Barycentre 1945-1995

$\endgroup$
2
  • $\begingroup$ There's a more general plotting script here, which can plot the distance between pairs of bodies known to Horizons. $\endgroup$
    – PM 2Ring
    Mar 31, 2022 at 19:55
  • $\begingroup$ Using the general plotting script, with a date range of 1698-Aug-8 to 2196-May-2, and a step of 2000, the mean distance is ~827,640 km. The graph crosses the mean line (going upwards) on those dates, so the area under the curve gives a more accurate mean. $\endgroup$
    – PM 2Ring
    Mar 31, 2022 at 21:52
8
$\begingroup$

The Sun's motion relative to the Solar System barycenter is dominated by the four planets Jupiter, Saturn, Uranus and Neptune. Neptune is a lot lighter than Jupiter but it's also a lot farther away, and contrary to intuition the farther out it is the larger the induced motion in the Sun around the barycenter.

*To first order we can treat the Sun's response to each planet as circular, and the final result as the linear superposition of four circular motions.

I lack the math background to derive the answer analytically, though I am confident someone will soon.

Approximate distances of the Sun to the mathematical barycenter of each binary Sun + planet pair, "amplitude":

 body        mass (Sun=1)    a (Rsun=1)    amplitude (Rsun=1)
Sun           1.000              -
Jupiter       9.548E-04      1.119E+03       1.068
Saturn        2.858E-04      2.060E+03       0.589
Uranus        4.366E-05      4.133E+03       0.180
Neptune       5.152E-05      6.465E+03       0.333

So the interesting thing is that if it were only for Jupiter, the Sun-Jupiter barycenter would always be slightly outside the Sun.

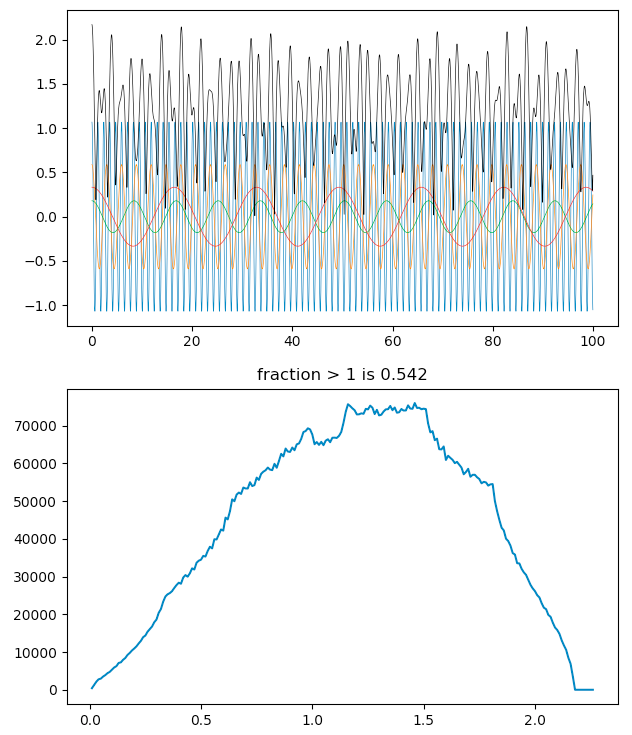
Let's run a simulation of four circular displacements with the amplitudes as shown and periods (not that it matters, as long as they are not rational number relationships) that scale as $a^{3/2}$ which conveniently will convert my four digit numbers into irrational numbers for me. :-)

As expected based on Jupiter alone putting the barycenter just outside the Sun, when all four main planets are taken into account the barycenter spends about 54% of the time outside the Sun (or the Sun spends 54% of the time further than one of it's radii from the barycenter).

median r:  1.209
mean r:    1.189
max r:     2.17
fraction:  0.542

The histogram of radial distances shows some interesting structure, which I think should be pursued further both mathematically and numerically.

Since this is a statistical analysis (there are no harmonic relationships between planets in this model) time could just as well be sampled randomly rather than using equal spaces.

Barycenter outside of one solar radius

In the plot above the $x$ value for each individual two-body motion is shown with color lines, but the absolute radial distance $r$ is shown in black for the combined motion.

import numpy as np
import matplotlib.pyplot as plt

amplitude = np.array([1.068, 0.589, 0.180, 0.333])
period = np.array([1.119, 2.060, 4.133, 6.465])**1.5

time = np.arange(0, 100000, 0.01)
xd = amplitude[:, None] * np.cos(2 * np.pi * time / period[:, None])
yd = amplitude[:, None] * np.sin(2 * np.pi * time / period[:, None])
r = np.sqrt(xd.sum(axis=0)**2 + yd.sum(axis=0)**2)

bins = 0.01 * np.arange(int(100 * amplitude.sum())+10)
a, b = np.histogram(r, bins=bins)

r_median = np.median(r)
r_max = r.max()
r_mean = r.mean()
fraction = (r > 1).sum() / r.sum() 

print('median r: ', r_median)
print('mean r:   ', r_mean)
print('max r:    ', r_max)
print('fraction: ', fraction)

n = 10000
lw = 0.5
fig, (ax1, ax2) = plt.subplots(2, 1)
for x in xd:
    ax1.plot(time[:n], x[:n], linewidth=lw)
ax1.plot(time[:n], r[:n], '-k', linewidth=lw)
ax2.plot(b[1:], a)
ax2.set_title('fraction > 1 is ' + str(round(fraction, 3)))
plt.show()
$\endgroup$
2
$\begingroup$

Not a direct answer to your question (which others have given already), but maybe still worth considering here:

The dynamics of the solar system can to a high degree of accuracy be calculated by assuming the sun and planets as point masses, so whether the barycenter lies inside or outside the defined surface of the Sun is physically not really relevant for anything, given that it is only a mathematically-defined point, and that the diameter of the Sun will change over time.

$\endgroup$

You must log in to answer this question.

Not the answer you're looking for? Browse other questions tagged .