4
$\begingroup$

Seeing the phrase a fully functional Stewart Platform I Wikipediad it and that article shows the AMiBA a CMB interferometer mounted on a hexapod (shown below).

Wikipedia's Sunyaev–Zeldovich effect; Observations shows the second image below, and the caption says:

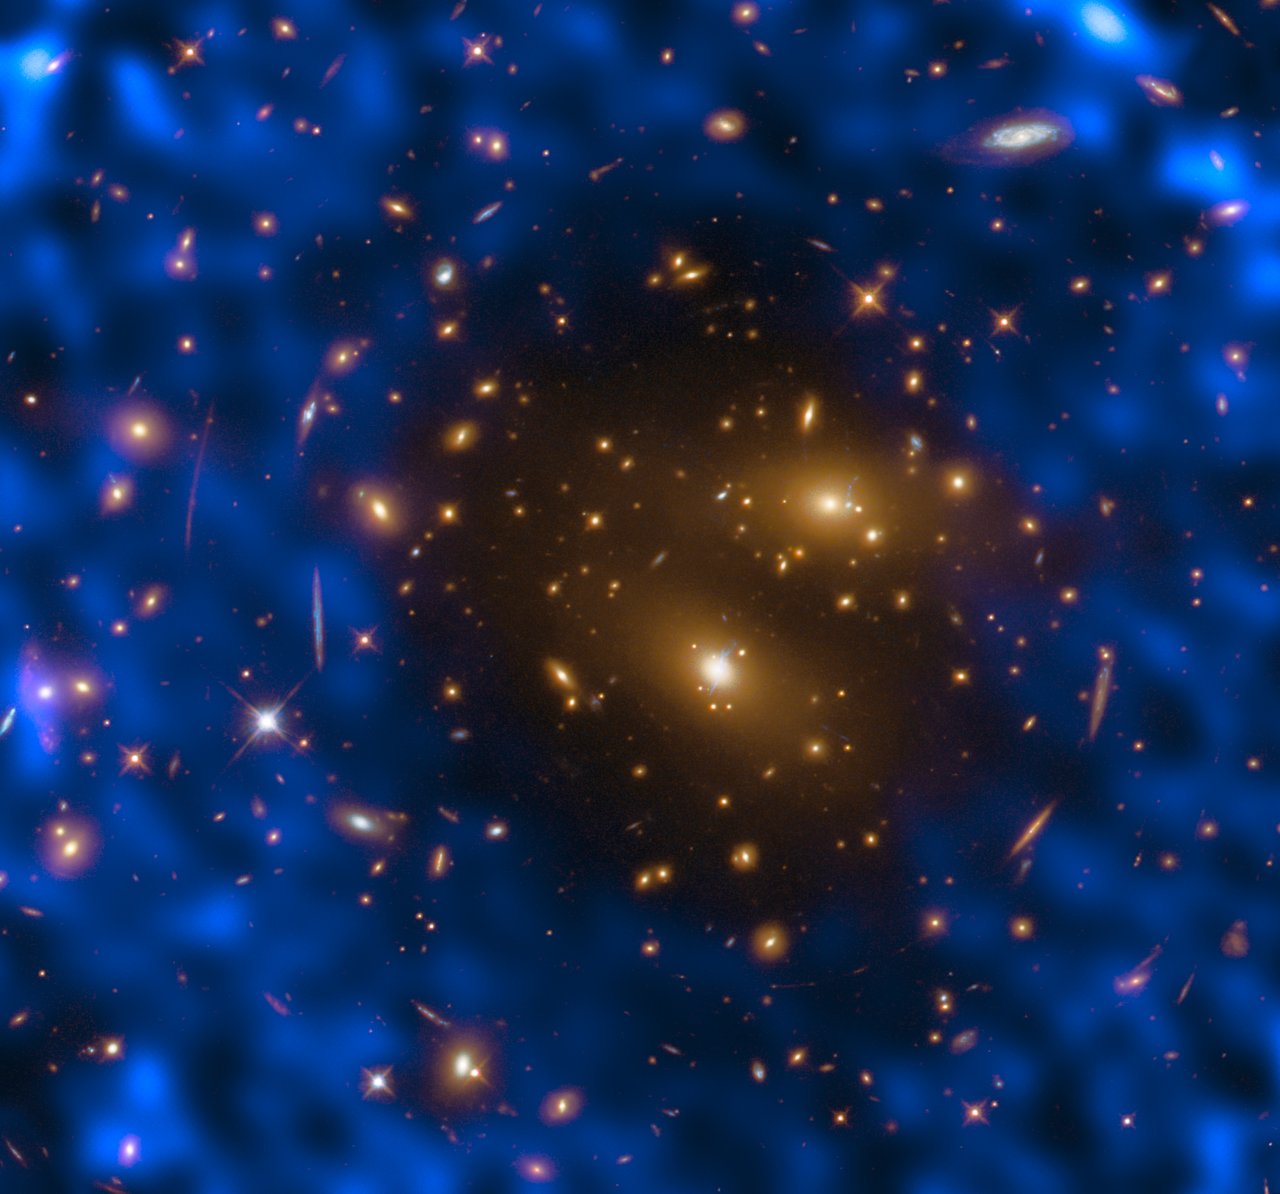
The energy distribution of the CMB photons shifts and appears as a temperature decrease at the wavelength observed by ALMA, hence a dark patch is observed in this image at the location of the cluster.

and yet the SZ effect should manifest as an apparent temperature increase!

How to reconcile these?

The Sunyaev–Zeldovich effect (named after Rashid Sunyaev and Yakov B. Zeldovich and often abbreviated as the SZ effect) is the spectral distortion of the cosmic microwave background (CMB) through inverse Compton scattering by high-energy electrons in galaxy clusters, in which the low-energy CMB photons receive an average energy boost during collision with the high-energy cluster electrons.

Question: Why does the first measurements of the thermal Sunyaev-Zel’dovich effect from ALMA show a temperature decrease and not an increase associated with a cluster of galaxies?


the first measurements of the thermal Sunyaev-Zel’dovich effect from the Atacama Large Millimeter/submillimeter Array (ALMA) in Chile (in blue)

above: This image shows the first measurements of the thermal Sunyaev-Zel’dovich effect from the Atacama Large Millimeter/submillimeter Array (ALMA) in Chile (in blue). Astronomers combined data from ALMA’s 7- and 12-metre antennas to produce the sharpest possible image. The target was one of the most massive known galaxy clusters, RX J1347.5–1145, the centre of which shows up here in the dark “hole” in the ALMA observations. The energy distribution of the CMB photons shifts and appears as a temperature decrease at the wavelength observed by ALMA, hence a dark patch is observed in this image at the location of the cluster. Links ESA/Hubble Picture of the Week https://www.eso.org/public/images/potw1708a/ source, below: AMiBA, a Cosmic Microwave Background experiment located in Hawaii, during construction in June 2006. source
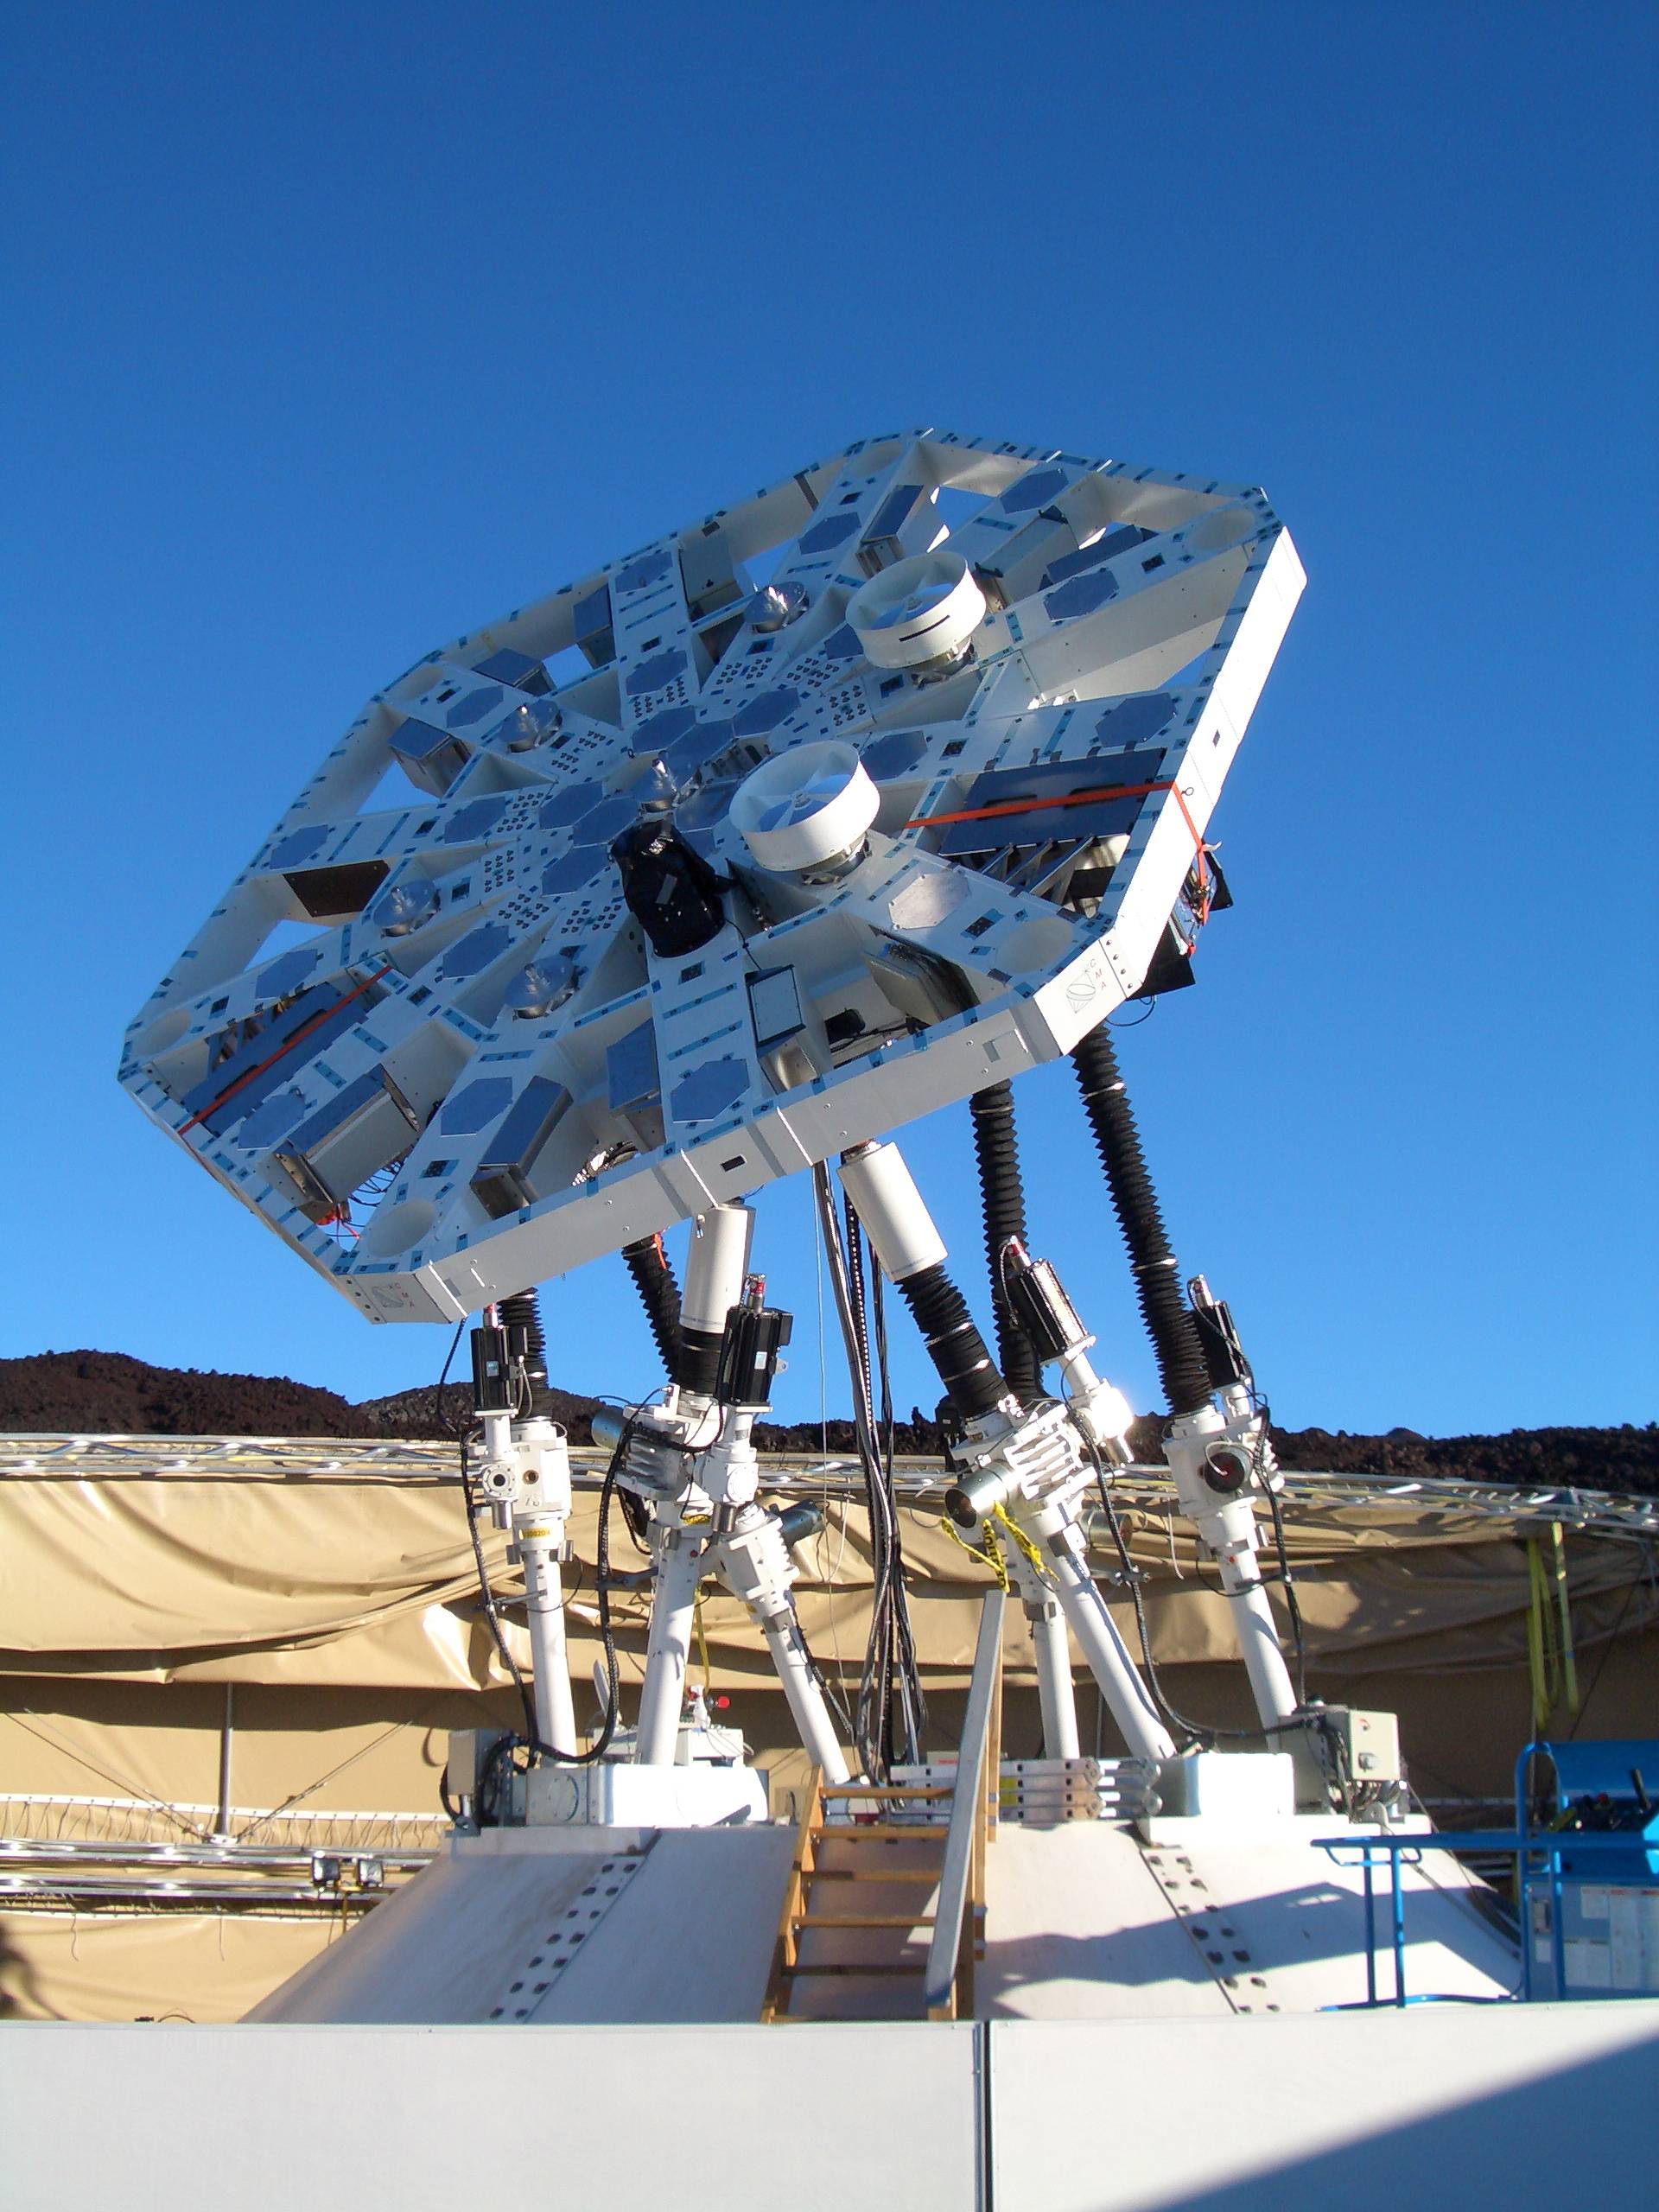
AMiBA, a Cosmic Microwave Background experiment located in Hawaii, during construction in June 2006

$\endgroup$

1 Answer 1

5
$\begingroup$

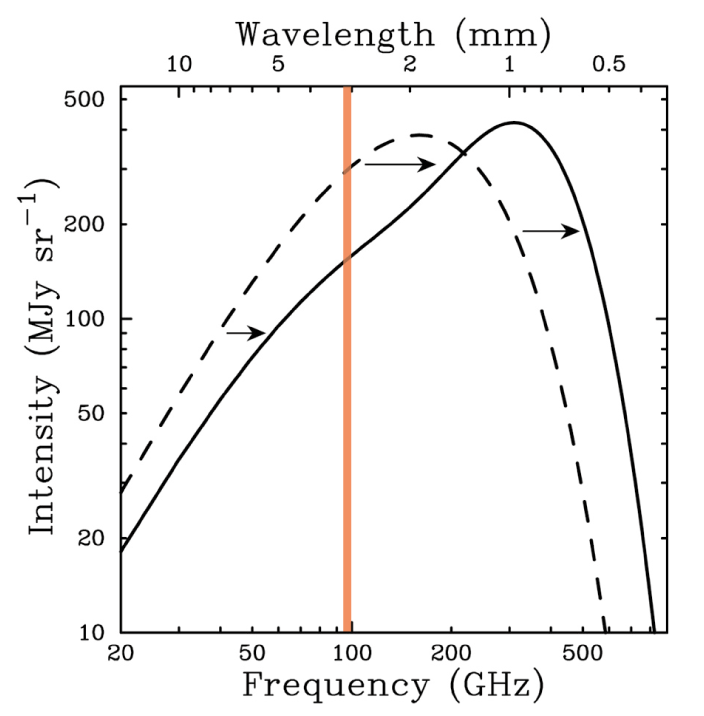
Calling it a "temperature decrease" is kind of misleading. (Possibly this is a side effect of the tendency to use "brightness temperature" in radio astronomy to mean measured intensity.) It's actually an intensity decrease in the 95 GHz band used in the observation. This comes about because the thermal Sunyaev-Zel'dovich effect tends to shift the photons to higher frequencies, but doesn't change the number of photons, so that the number of photons at frequencies below about 218 GHz decreases (and the number of photons at higher frequencies increases).

This figure shows the basic effect (I've indicated the approximate frequency of the ALMA observations in orange.) enter image description here Exaggerated thermal S-Z effect. The dashed curve is the original CMB spectrum, while the solid curve is the shifted spectrum. From Carlstrom et al. (2002).

Thus, you see lower 95 GHz intensity inside the cluster (solid curve), relative to the unmodified cosmic microwave background outside the cluster (dashed curve). If you actually measured the full spectrum, you'd see that the spectrum inside the cluster corresponds to a higher temperature, as you expect.

$\endgroup$
3
  • $\begingroup$ Yes this seems to explain it nicely, thanks! Had they observed at say 500 GHz (not sure they could at the time) there would have been a brightening and it would have been a larger effect perhaps, but there could be other reasons why 95 GHz was chosen. Thanks! $\endgroup$
    – uhoh
    Commented Jan 30, 2022 at 22:26
  • 1
    $\begingroup$ This plot shows that the atmospheric transparency at 500 GHz is less than half that at 95 GHz... $\endgroup$ Commented Jan 31, 2022 at 23:17
  • $\begingroup$ ALMA is above most of Earth's atmospheric water, does that plot represent sea level? update: Yes it seems it does! :-) Looks like that's for a precipitable water vapor of only about 1 mm (1, 2) $\endgroup$
    – uhoh
    Commented Jan 31, 2022 at 23:27

You must log in to answer this question.