This question has been completely rewritten as I have found a bit more information and been helped enough to hopefully ask this question better.
Hi everyone. I am an undergraduate pursuing an honors research project for one of my astronomy classes. I have chosen to simply determine how the specific star formation rates (SSFRs) of galaxies have changed over time by plotting SSFR over redshift or 'z.' However, I have ran into a problem as two of my catalogs have these strange data spikes that I am confident are faulty and skewing the data I already have.
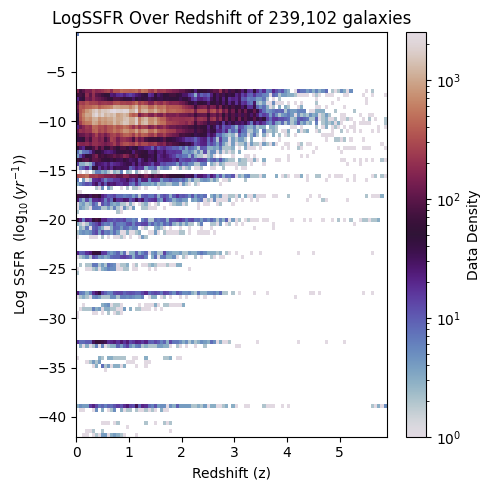
I am using 3 catalogs. First used is The CANDELS/SHARDS Multiwavelength Catalog in GOODS-N (specifically its J/ApJS/243/22/fast & J/ApJS/243/22/phot1 tables) which we'll call C1; the second, with the best data, is the Revised SWIRE photometric redshifts catalog which we'll call C2; and finally. the one I need the most help with, the Public $K_s$-selected Catalog in the COSMOS/ULTRAVISTA Field (notably using data from the J/ApJS/206/8/m05 & J/ApJS/206/8/catalog tables, also the image above is using data from this catalog) which we'll call C3.
I have somewhat read the articles linked to the data I've pulled from VizieR from these catalogs however, I've yet to find anything that could be causing these spikes in the methods and data provided by these papers. I've used Vizier to already do some filtering for me related to NaN values and object type (no stars), and I've plotted the data on an Aitoff projection to ensure there's no double values between the separate catalogs.
The strange data spikes appear to be intrinsic to the actual data found in the tables and unrelated to anything of my own doing. I have determined this by looking at my maximum and minimum values in the data and noticing some crazy numbers that simply cannot be real (stuff like log(SFR) having values in the -30's).
Below is the code I used to plot the three catalogs side by side with the exact same axes. The order from left to right is: C3, C2, C1.
fig, axs = plt.subplots(1, 3, figsize=(15, 5), tight_layout=True)

h = axs[0].hist2d(z5, logsSFR5, bins=100, norm=colors.LogNorm(), cmap='twilight')
axs[0].set(title=r'LogSSFR Over Redshift of 239,102 galaxies',
       xlabel='Redshift (z)', ylabel=r'Log SSFR   $(\log_{10}(yr^{-1}))$',
       ylim=(-15,3))

h = axs[1].hist2d(zph0, logsSFR2, bins=100, norm=colors.LogNorm(), cmap='twilight')
axs[1].set(title=r'LogSSFR Over Redshift of 233,700 galaxies',
       xlabel='Redshift (z)', ylabel=r'Log SSFR   $(\log_{10}(yr^{-1}))$')

h = axs[2].hist2d(newpd['zbest3'], logsSFR3, bins=100, norm=colors.LogNorm(), cmap='twilight')
axs[2].set(title=r'LogSSFR Over Redshift of 34,924 galaxies',
       xlabel='Redshift (z)', ylabel=r'Log SSFR   $(\log_{10}(yr^{-1}))$',
       ylim=(-15, 3))

plt.show()
From graphing all of these we can see two notable and annoying problems with the data from C1 and C3:
1.) For some reason, the data has a hard cutoff somewhere between SSFR values -8 and -5. This is also potentially a problem of false values.
... And 2.) There exists those data spikes at strange SSFR values undoubtedly skewing any data analysis I wish to do with all three catalogs combined.
So, my question to the community is, how do I filter out these data spikes from my data without ruining the good data I have from C2 (assuming I combine all three catalogs) or otherwise... what are these data spikes, as if I know perhaps I can better determine how to either filter them out OR fix their values. If that can also not be achieved I'd at least like some advice on how to smooth out whatever data remains after I am likely forced to create a hard cutoff point for the data.
I have a couple theories related to what is causing these spikes... either these are some weird default values from the data/methods the team who made these catalogs created. These could also be repeats of specific galaxies but with different redshifts (I don't know how or why that'd happen but it's an idea). My only problem is that the sheer volume of data that is... wrong, seems way too high for a "minor errors in every catalog" explanation.
The data, for those interested, is as follows:
(NOTE: you will need to look at the "preferences" box on the right side and select your choice of file format and set the number of returns to unlimited to get the full scope of the data on all of these, you can otherwise truncate the data down to about 1000 rows for an HTML table before things become unbearably slow)
Thank you for any help and patience you provide.

