I posted such a question in space.stackexchange, but probably it fits better here, being it a "topocentric problem", although for other planets than Earth; we could call it "eso-astronomy" ;-)
I am trying to figure out how to retrieve the right data from Nasa Horizons to plot sun analemmas as seen from other worlds; I found a query which works fine for Earth, but upon changing the observer location from Earth to other planets, things get weird, and I get wrong curves w.r.t "official" curves (although there is not a single analemma curve for each planet, but different curves for different times).
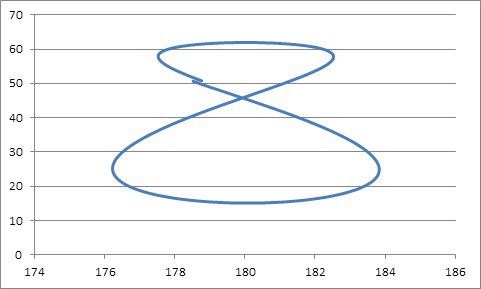
This is the query I am using for Earth analemma centered on Greenwich at 12.00:
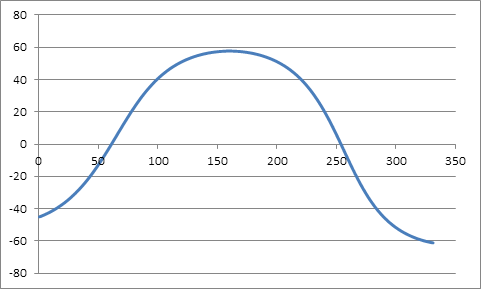
Using same coordinates on mars, a longer period, and 1477 minutes as interval (martian day length), I don't get the right plot (link):
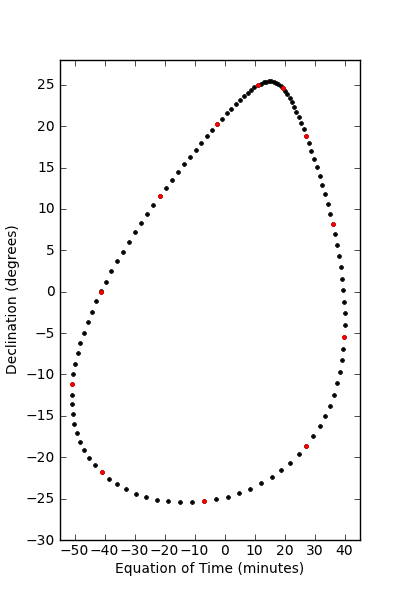
The right analemma on Mars is this:
I noticed that Earth analemmas are plotted against Azimuth, but Mars analemmas are plotted against Equation of Time. Why? And how can I do by myself such a plot in Excel?


