Per this diagram why are the larger (30 meter and European) mirrors filled out to nearly a full circle, while the smaller mirrors composed of hexagons retain a hexagonal border limit instead of filling out and approximating a full circle?
-
2$\begingroup$ I'm not sure I'm seeing this. Could you make for example the SALT more circular by "filling out" I think adding extra hexes would tend to make it less circular. $\endgroup$– James KCommented Apr 16, 2020 at 20:31
-
1$\begingroup$ The smaller the individual hexagons, the closer you can approximate a complete circle. There must be calculations for driving cost vs. individual hexagon size vs. required or desired coverage, which were done for each telescope. Perhaps examples are online somewhere. $\endgroup$– Witness Protection ID 44583292Commented Apr 17, 2020 at 21:07
2 Answers
Start by drawing the largest inscribable circle (circle completely contained within the mirror assembly). Then draw, e.g., the smallest superscribing circle (completely contains all the mirrors), and calculate how many more hexagons are needed to fill the additional area covered.
Finally, draw the circle showing the design entrance aperture of the telescope to see how much of the aperture is lost vs. how much of the outer hexagons' area is unused in each case.
Then do a cost vs. quality tradeoff. Take into consideration (for the smaller telescopes) the delta cost of using more, smaller hexagons.
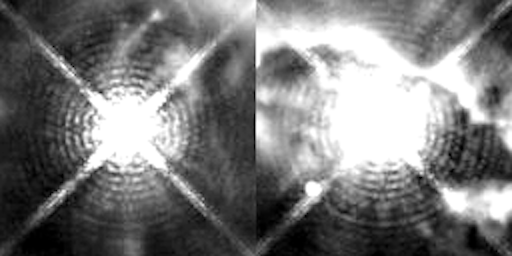
Just for fun here's the diffraction pattern from Hubble's circular aperture and 4-vane secondary support. Most of the time the concentric rings are not visible because images are broadband and they get washed out, but they are here because the exposure is through a narrow-band filter. From What is the cause of all of these sharp, concentric rings around bright stars in this HST image?
This is a partial answer.
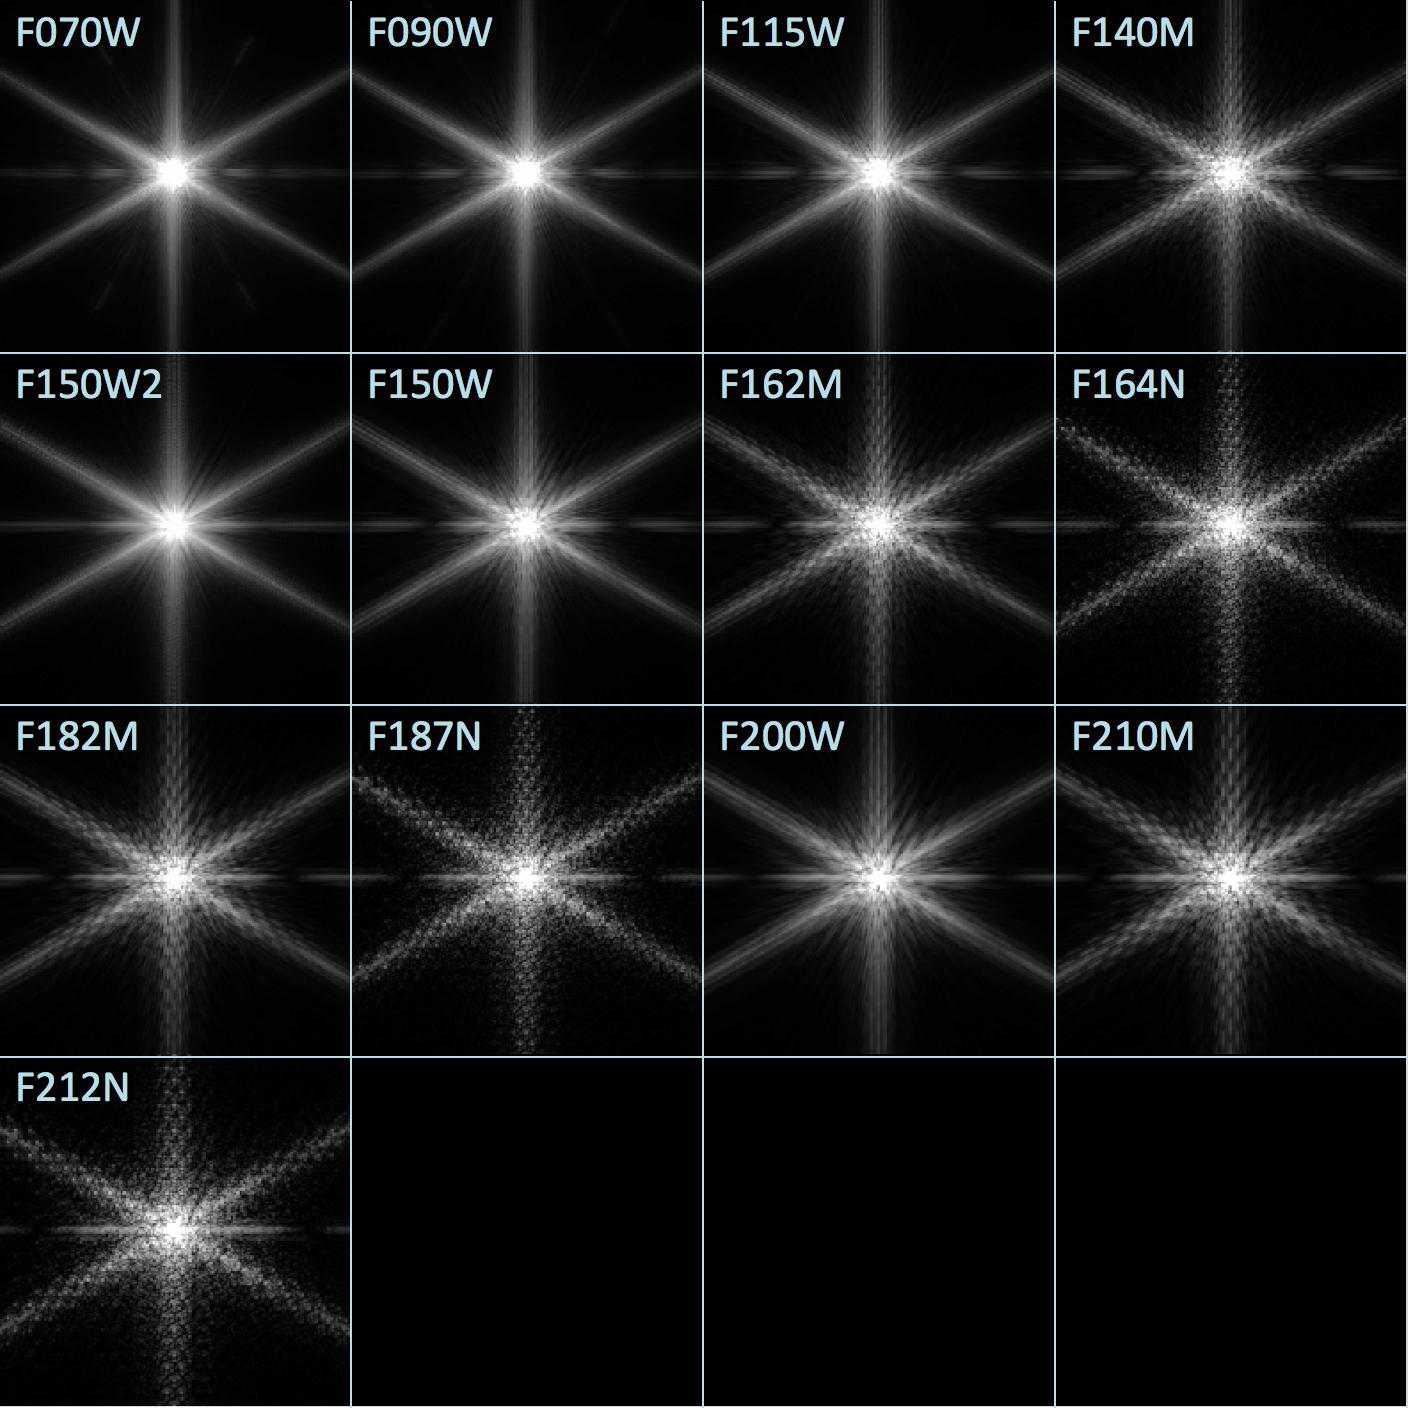
Each small mirror will impose its own strong six-spiked diffraction pattern in the telescopes point-spread function. For telescope apertures build from a large number of hexagonal mirrors this will dominate the point-spread function.
The choice of pattern for the tiling of small mirrors to fill the full aperture will have a much smaller effect.
JWST simulated point spread function from James Webb Space Telescope User Documentation's NIRCam Point Spread Functions
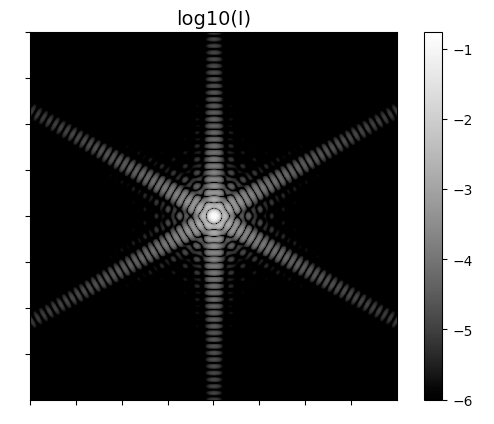
I found an analytical expression for the diffraction pattern from (or at least the Fourier transform of) a single hexagonal aperture (or flat mirror) in this answer to How does Fraunhofer diffraction depend on the orientation of the sides of a lens? in Physics SE.
Hexagonal aperture. I take the following function: $$ \begin{split} h(x,y) = \left[\theta(2y+\sqrt{3})-\theta(2y-\sqrt{3})\right]\cdot \left[\theta(y-\sqrt{3}(x-1))-\theta(y-\sqrt{3}(x+1))\right]\cdot\\ \left[\theta(y-\sqrt{3}(-x-1))-\theta(y-\sqrt{3}(1-x))\right] \end{split}$$ With $\theta(x)$ -- is a Heaviside step function.
While it is in principle possible to calculate the Fourier transform of this by hand, I've just fed it to CAS and I've got something like this: $$\frac{2\sqrt{3}\omega_x\left(\cos\frac{\omega_x}{2}\cos\frac{\sqrt{3}\omega_y}{2} -\cos\omega_x\right)-6\omega_y\sin\frac{\omega_x}{2}\sin\frac{\sqrt{3}\omega_y}{2}} {\pi \omega_x(\omega_x^2-3\omega_y^2)}$$ ...plus some singular terms that I've dropped.
Plotting square of the result (from -100 to 100)
Here's my plot and a python script based on that expression:
import numpy as np
import matplotlib.pyplot as plt

def hexamp(omx, omy):
    """diffraction amplitude hexagonal aperture from
    https://physics.stackexchange.com/a/9910/83380"""
    C, S = np.cos, np.sin
    rt3 = np.sqrt(3)

    term_1 = 2 * rt3 * omx * (C(omx/2.)*C(rt3*omy/2.) - C(omx))

    term_2 = -6 * omy * S(omx/2.) * S(rt3*omy/2.)

    bottom = np.pi * omx * (omx**2 - 3.*omy**2)

    return (term_1 + term_2)/bottom

omega = np.arange(-100, 100, 0.1)
omx, omy = np.meshgrid(omega, omega)

amplitude = hexamp(omx, omy)

I = np.abs(amplitude)**2

if True:
    plt.figure()
    plt.imshow(np.log10(I), cmap='gray', vmin=-6)
    plt.gca().set_aspect('equal')
    plt.gca().axes.xaxis.set_ticklabels([])
    plt.gca().axes.yaxis.set_ticklabels([])
    plt.colorbar()
    plt.title('log10(I)', fontsize=14)
    plt.show()


