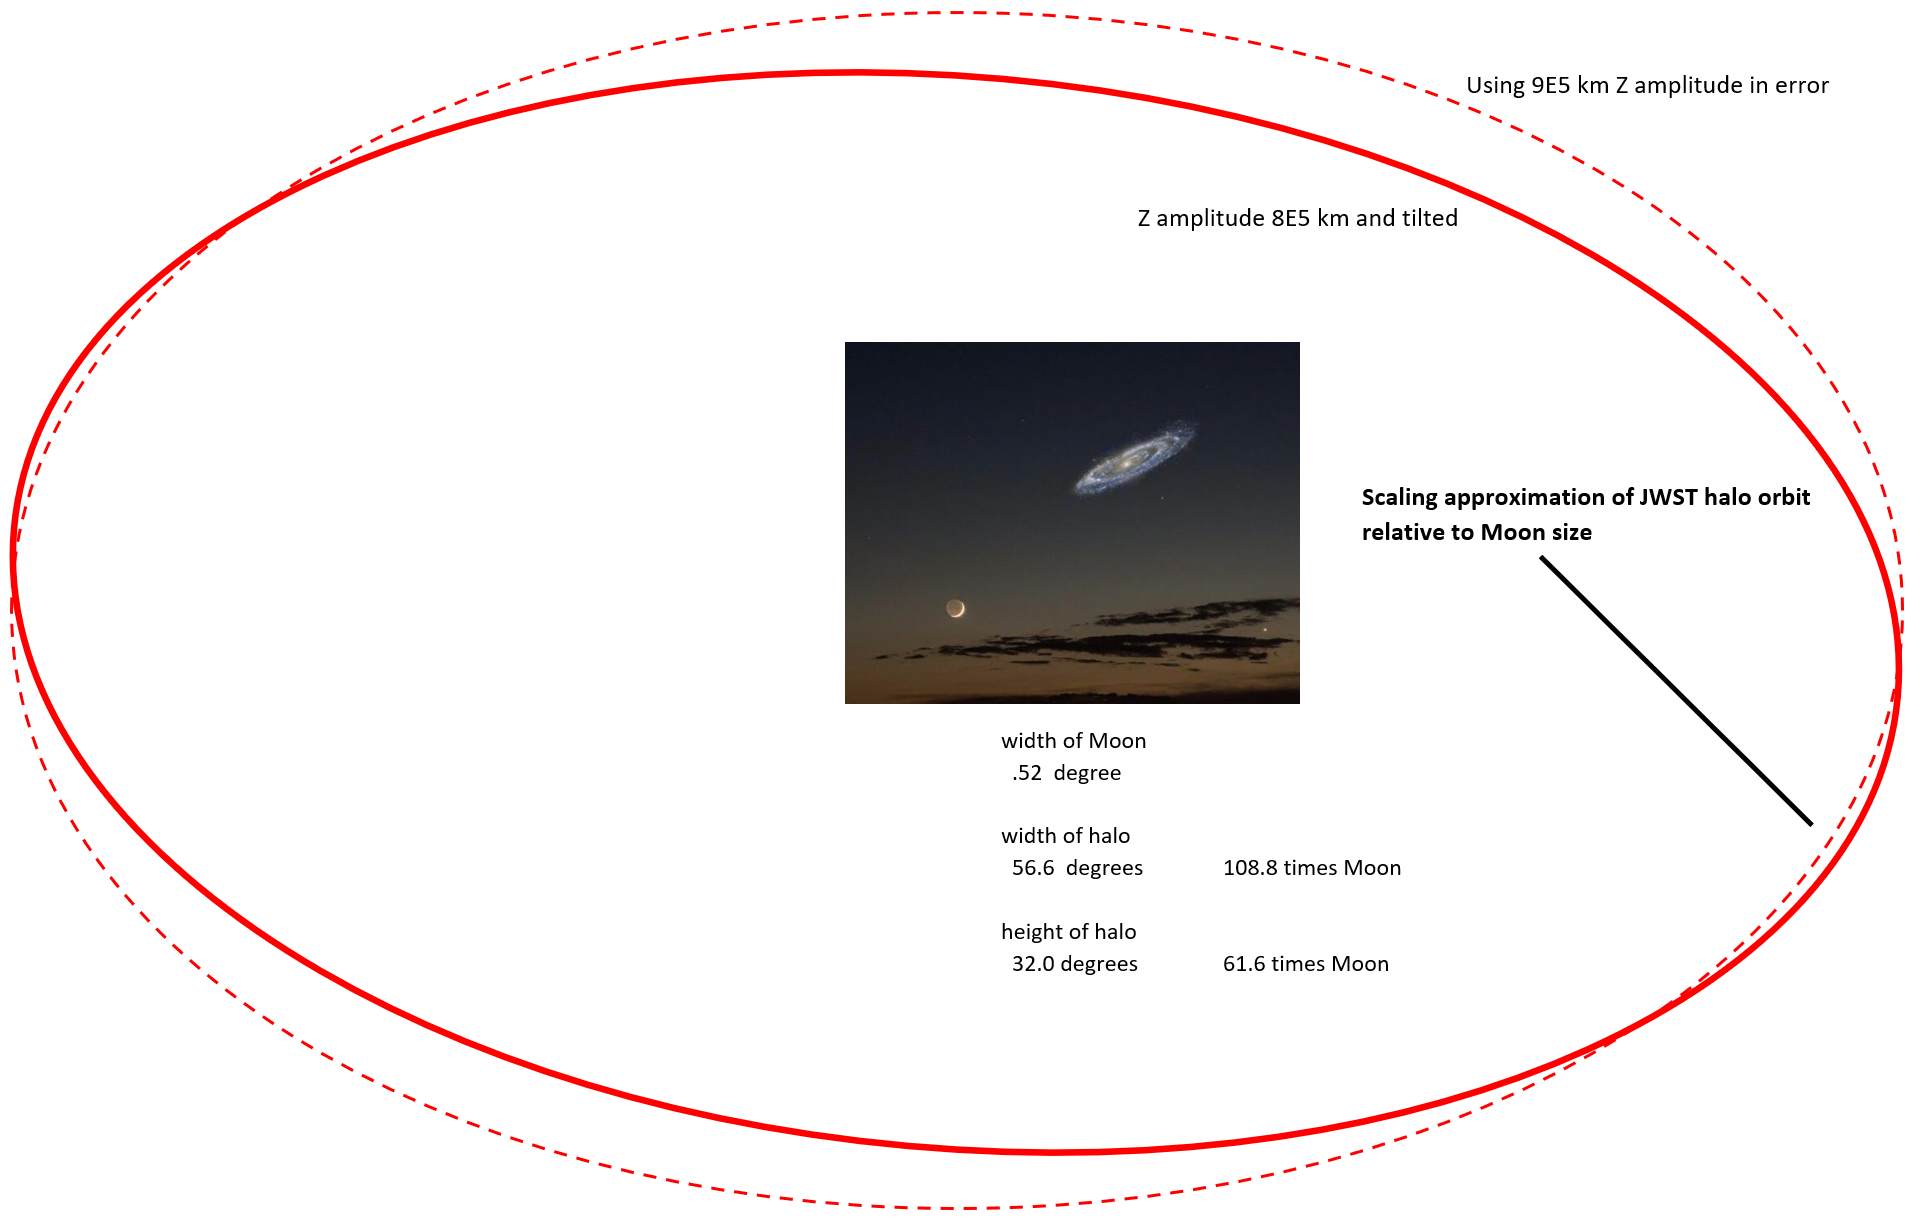
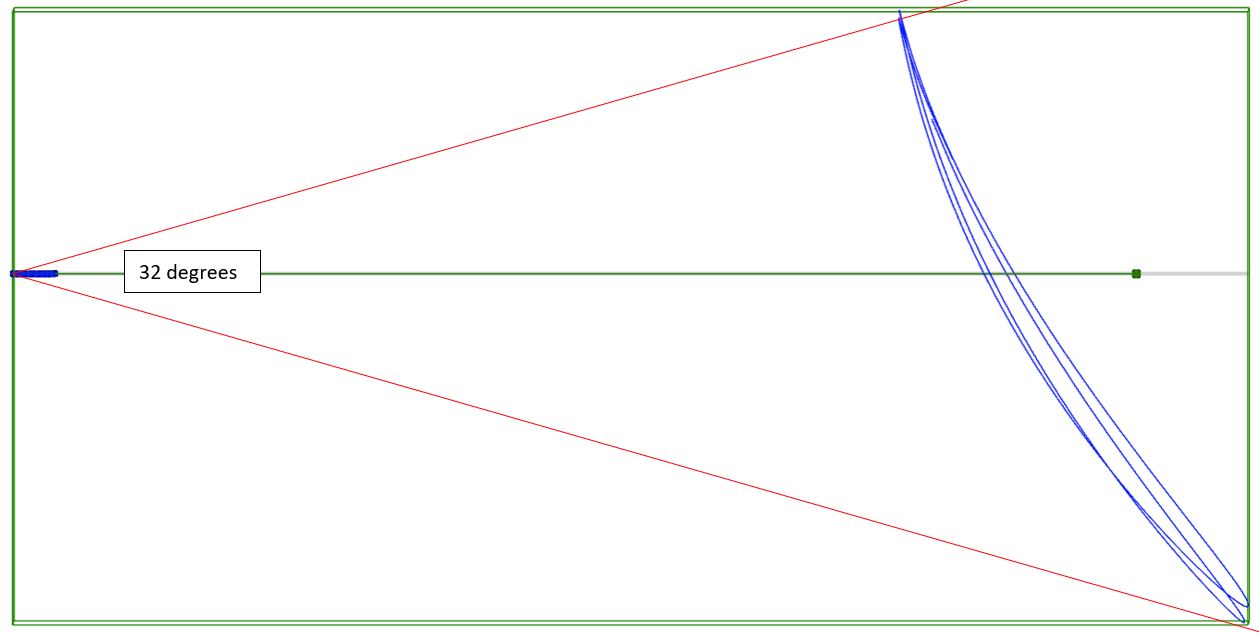
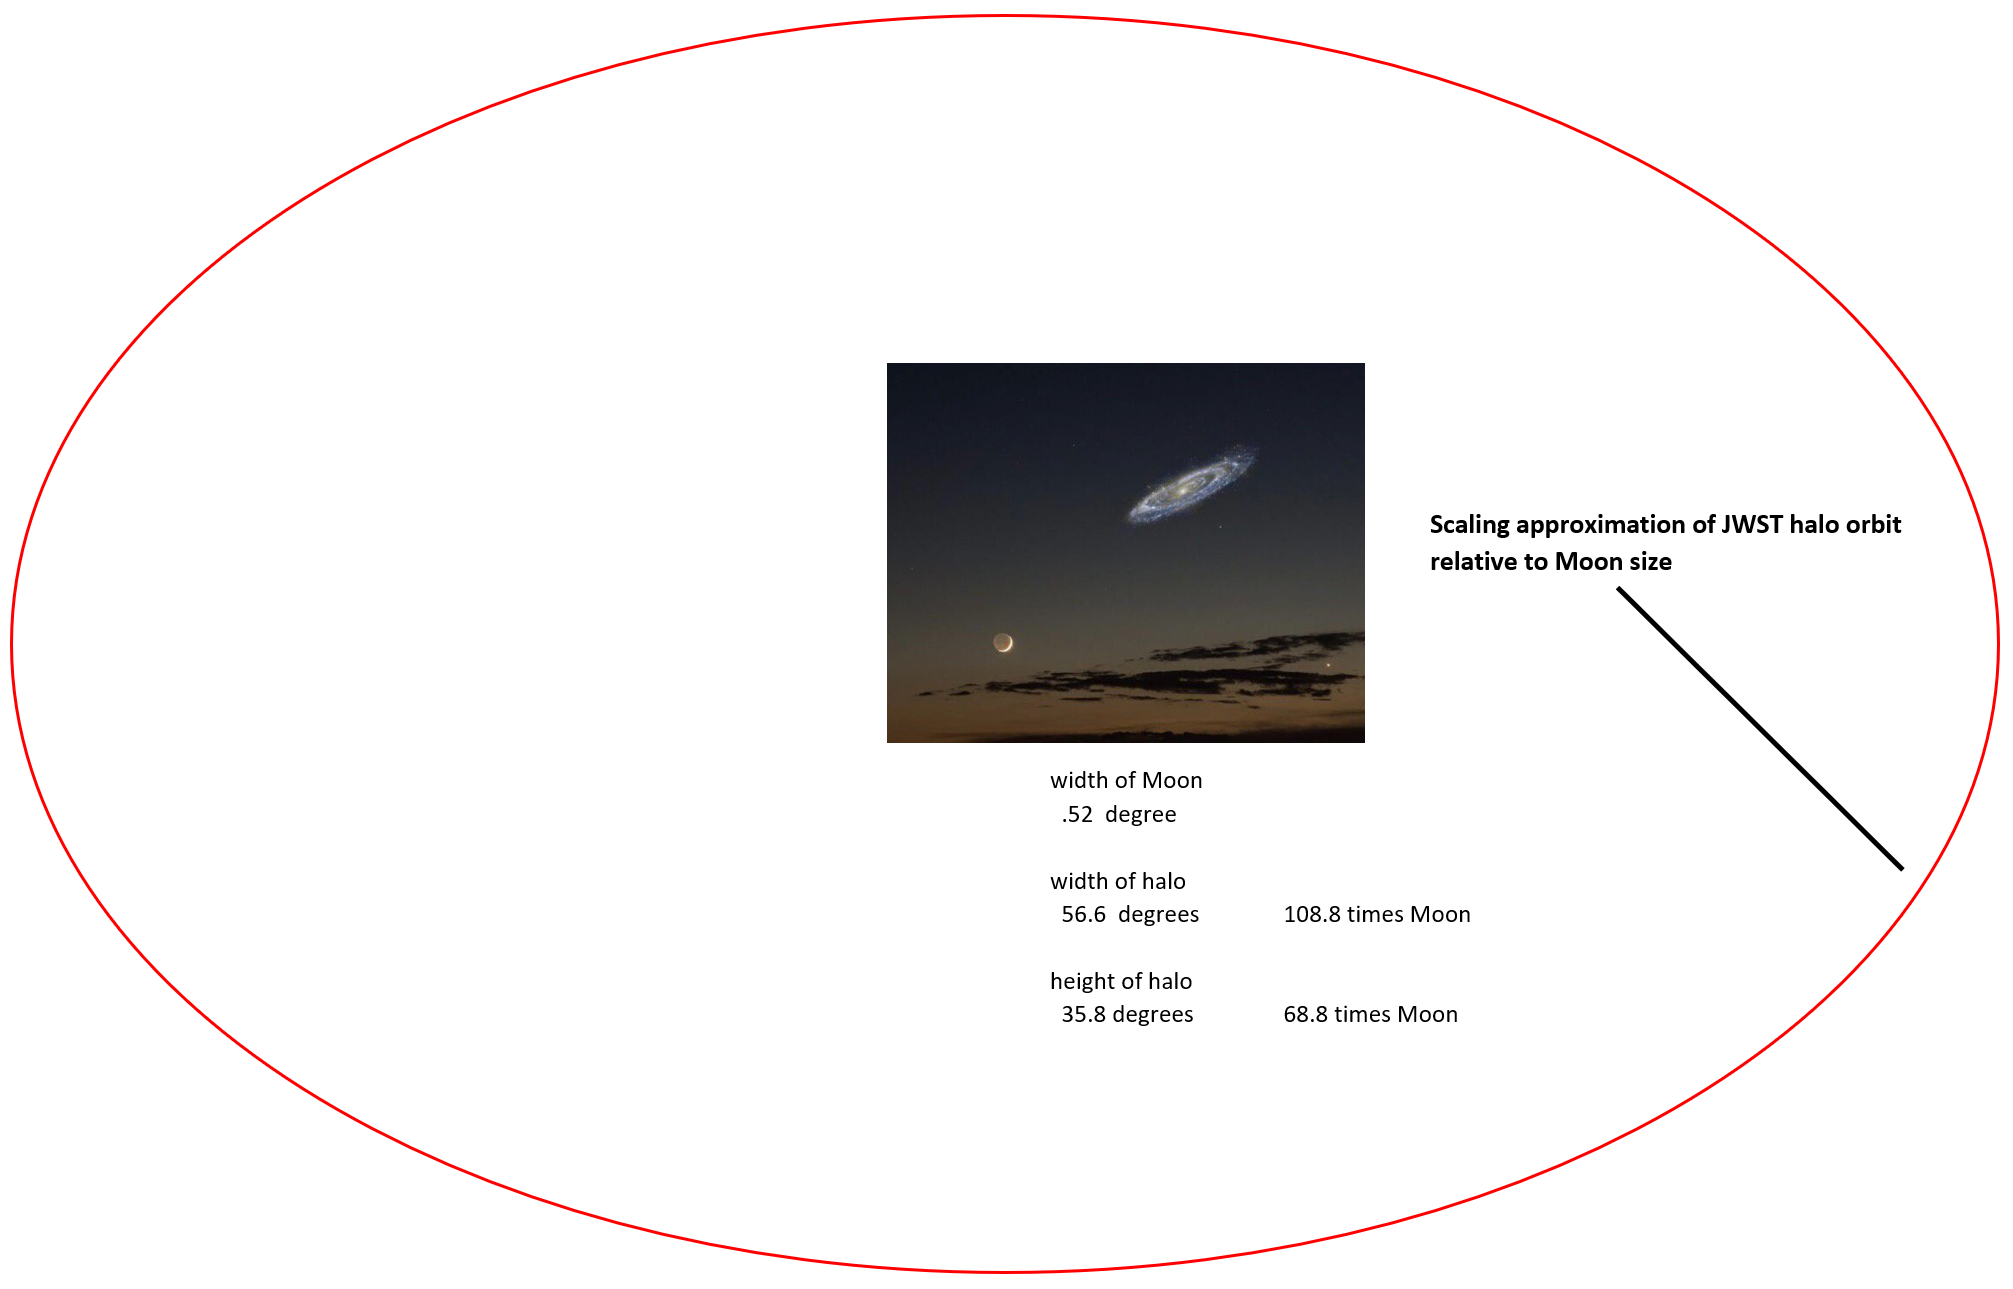
Yes, your diagram and numbers are basically correct.
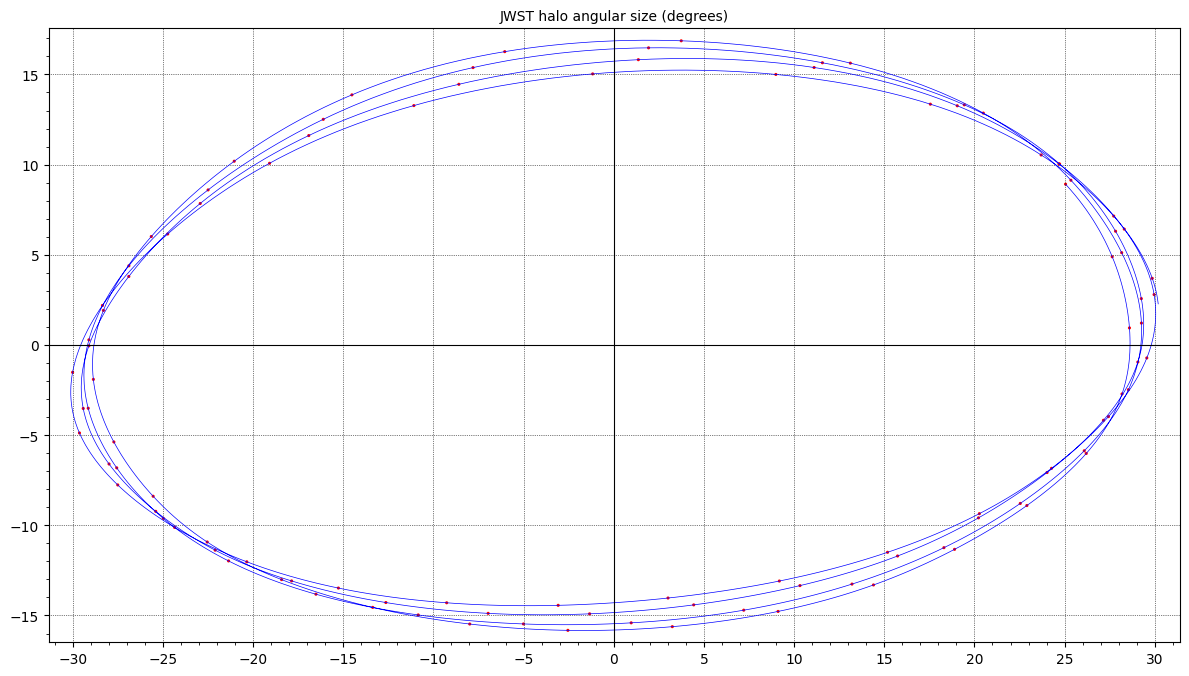
Here's a plot from Horizons. I got the 3D coordinates of the JWST (in the frame where Earth is fixed and L2 isn't rotating, with the ecliptic as the XY plane), projected them onto a sphere (centred on the centre of the Earth), and converted them to longitude & latitude. So these coordinates are essentially ecliptic longitude & latitude, but using L2 as the zero point, instead of the vernal equinox. Here are the results.
The curve was calculated using 1 day steps, but the red dots are 7 days apart.
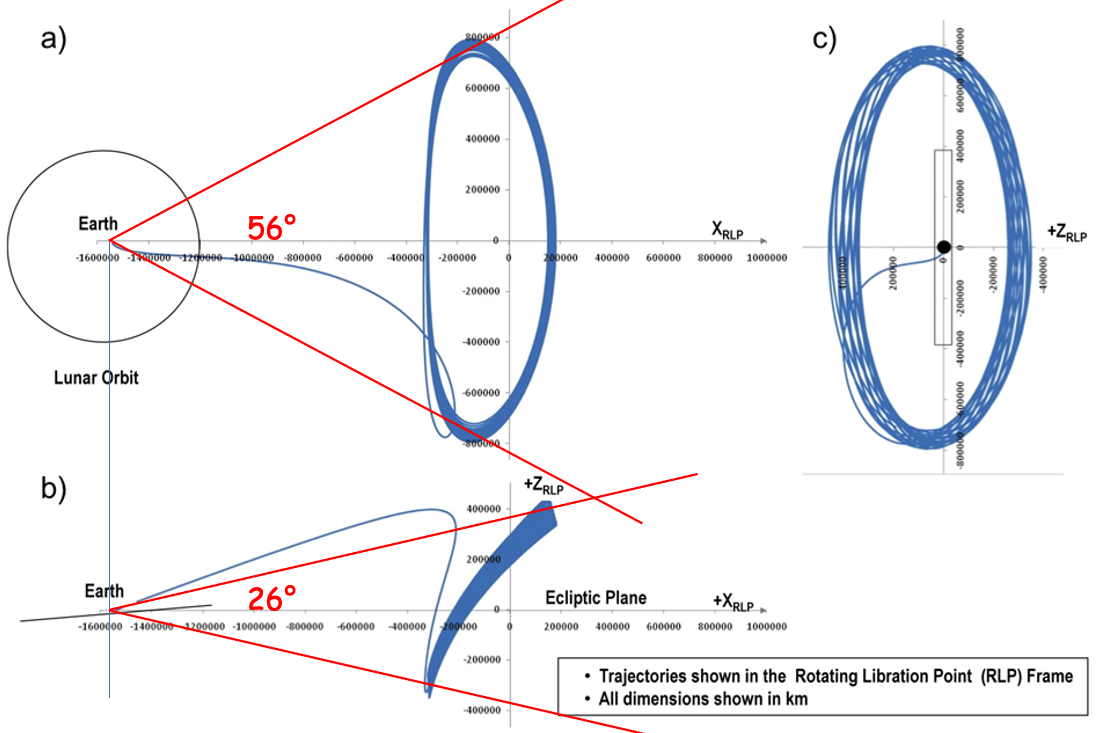
Here are a few other relevant graphics.
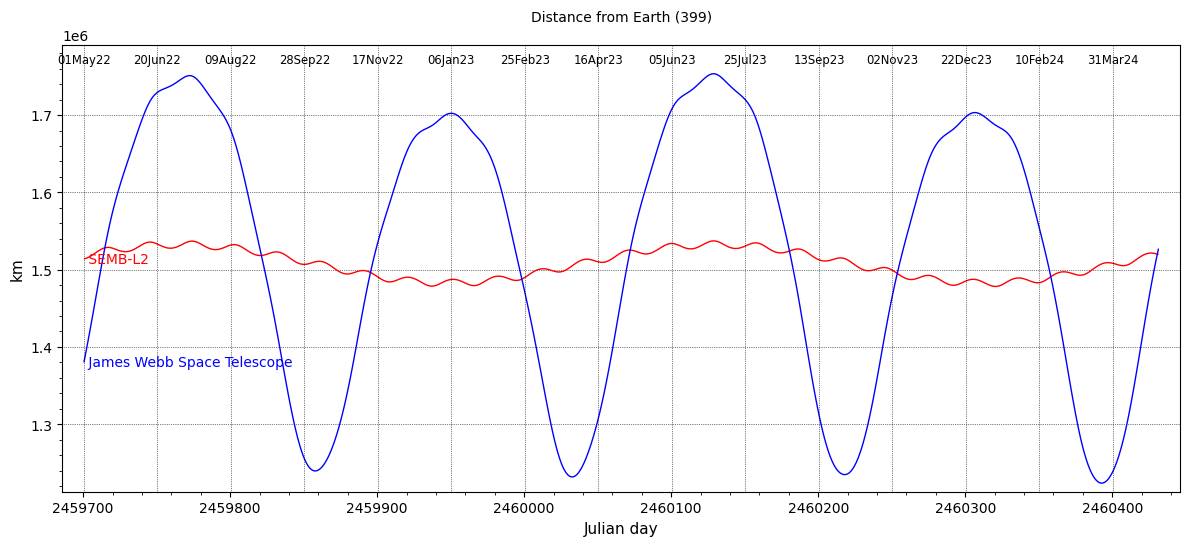
The distance from Earth to L2 isn't constant, but its variation is fairly small relative to the overall distance, and relative to the variation in the distance from Earth to the JWST.
Here's a daily plot (courtesy of Horizons) of the distance from the centre of the Earth to the JWST and the SEMB-L2, covering 2 years.
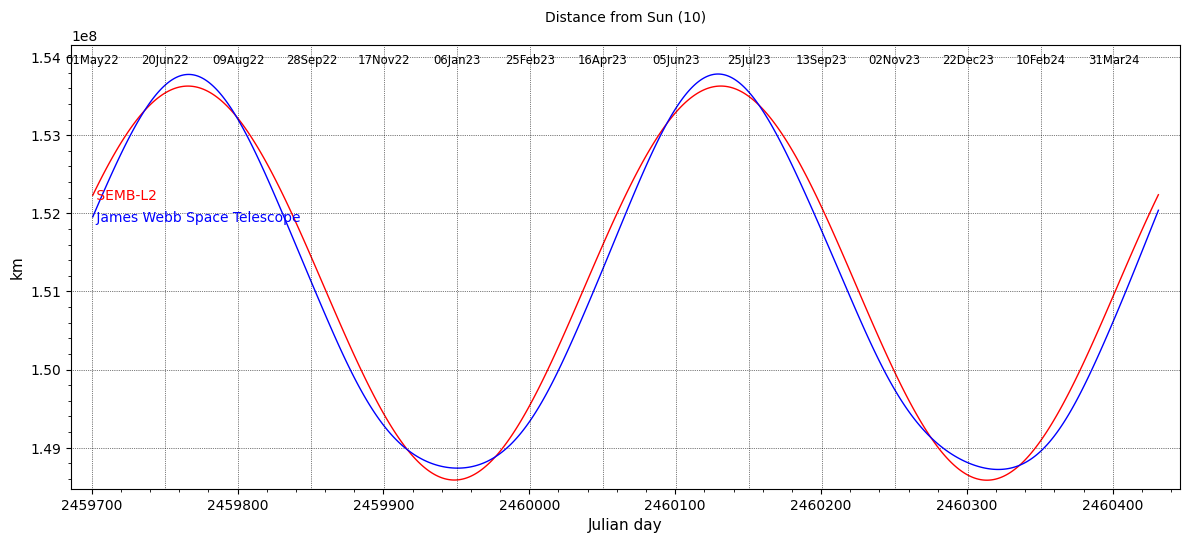
Here's the corresponding plot of their distance from the centre of the Sun.
The script for those plots can be found here.
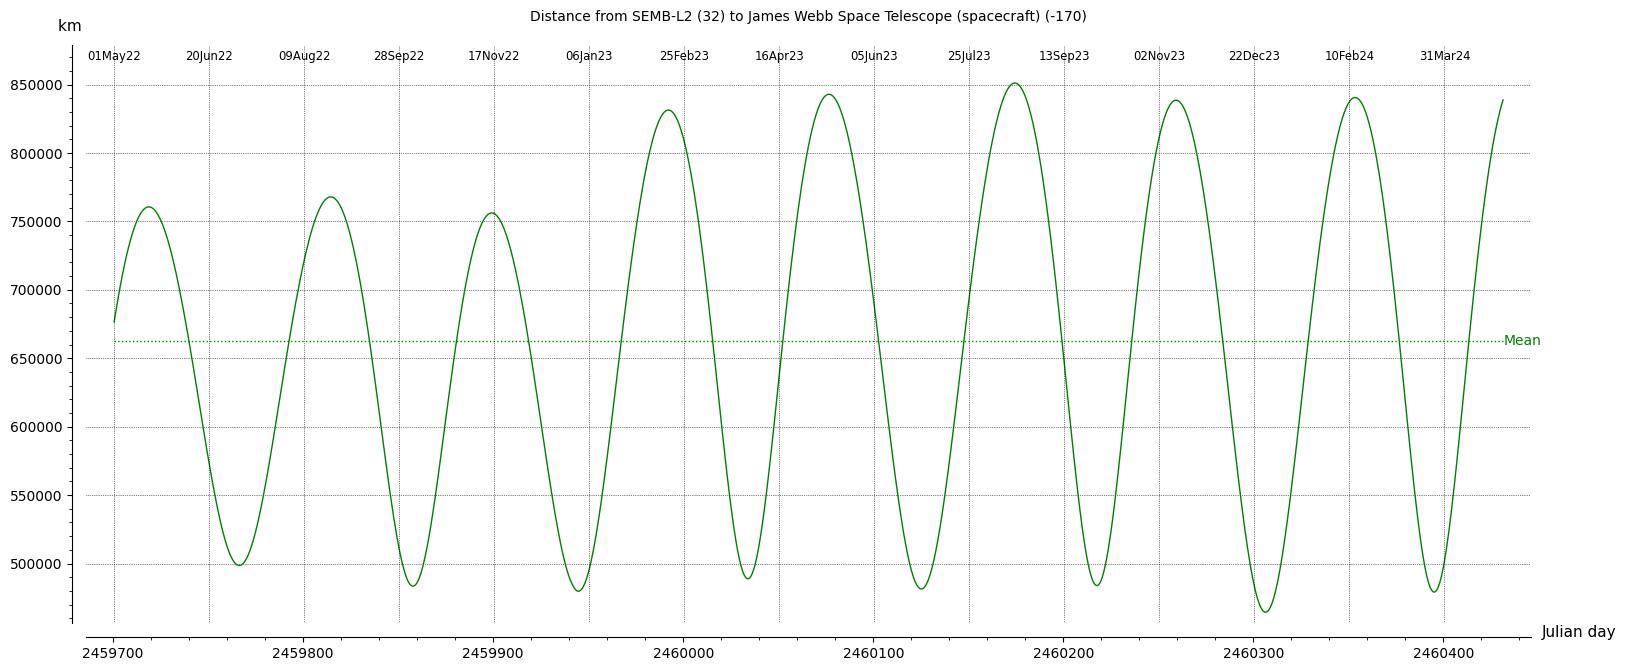
Here's a daily plot of the distance from L2 to JWST, using the script in this answer.
The Horizons data for the JWST was revised a couple of weeks ago. Trajectories are now "based on data through ~15:00 UTC May 30, predicts thereafter". See the Horizons JWST body data page for current details.
Here's an interactive 3D plot of the JWST's orbit in the rotating frame (essentially an update to a script in my answer to a Space.SE question on the JWST orbit). This version shows the Earth (in blue). The green dot is L2, and the purple line is the Sun-Earth axis. The body dots are not to scale!
Here's a cropped, frameless, perspective view from that plot.
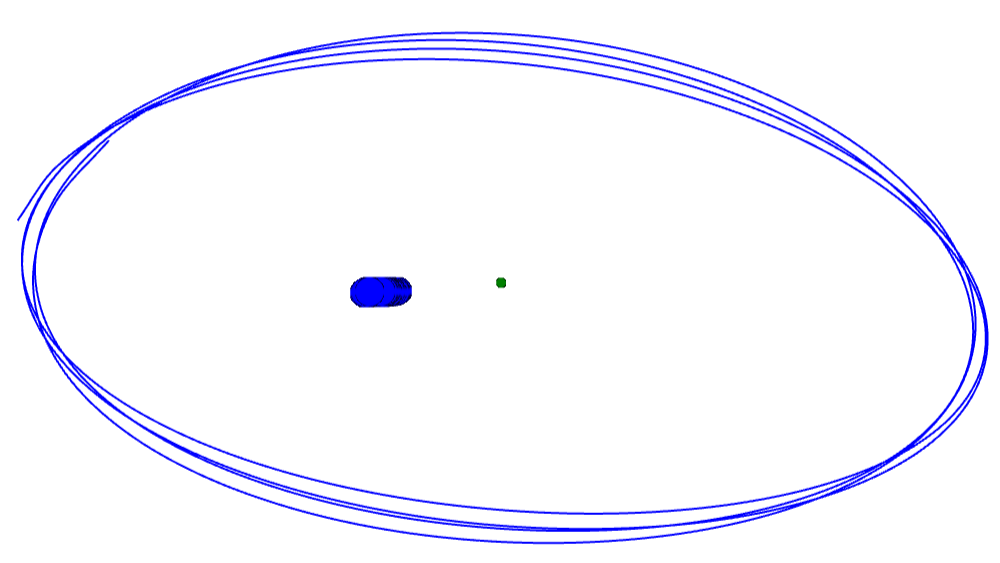
Sorry, it doesn't show the angular size of the Moon, but at least it illustrates the shape of the halo. ;)
Update
The 3D plot can now show the trajectory either in the corotating frame where L2 is fixed, or where Earth is fixed.
