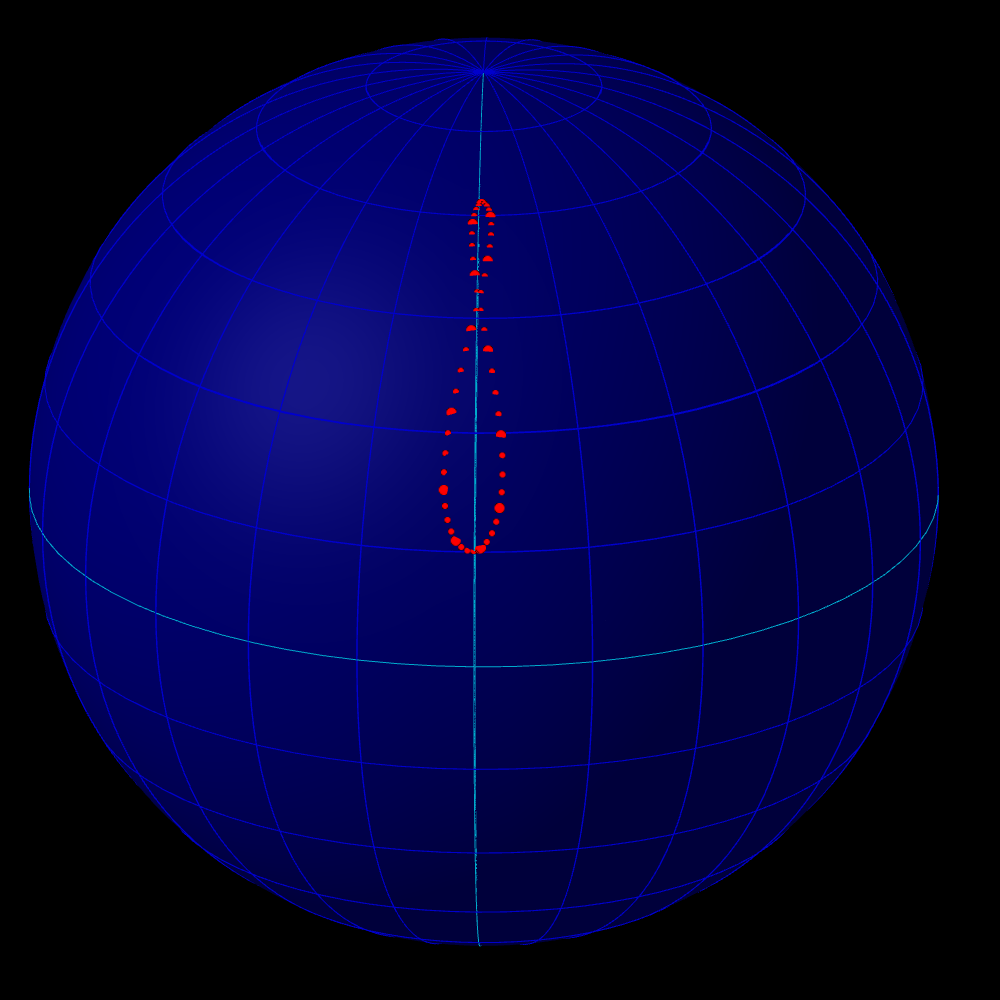
Here's a Sage / Python program which creates analemma diagrams using data from JPL Horizons. The azimuth + elevation data is displayed in 3D on a globe, which can be rotated & zoomed. (Sage uses three.js for interactive 3D graphics).
Please note that this globe displays the azimuth and elevation, so its poles are the zenith and nadir, the horizontal circles are lines of equal elevation (corresponding to parallels of latitude on a normal globe), and the vertical semicircles are lines of equal azimuth (corresponding to meridians of longitude on a normal globe).
You can supply the location using coordinates in longitude, latitude, altitude form, or you can supply the site ID using the MPC code of an observatory. The altitude, given in kilometres, is relative to the WGS-84 reference ellipsoid (as used by GPS), so it's very close to altitude relative to mean sea level.
If you supply a site ID the data in the lon, lat, alt field is ignored. To specify lon, lat, alt, put coord in the site field, or leave it blank. If you put * in the site field, Horizons will list all the MPC sites. You can also fetch the list with this URL.
To create a correct analemma you need to specify the time zone as part of the start time field. Eg, to make a noon analemma for longitude 30°E, the time should be 12:00 UT+2 or 12:00 UT+2:00.
Horizons can estimate the effects of atmospheric refraction, if desired. (The true refraction depends on the weather). The effects of refraction are fairly small around noon, but are significant near dawn and dusk.
Here's the relevant entry from the Horizons manual:
4. Apparent azimuth & elevation (AZ-EL) :
Apparent azimuth and elevation of target. Adjusted for light-time, the gravitational deflection of light, stellar aberration, precession and nutation. There is an optional (approximate) adjustment for atmospheric refraction (Earth only).
Azimuth is measured clockwise from north: North(0) -> East(90) -> South(180) -> West(270) Elevation angle is with respect to plane perpendicular to local zenith direction.
TOPOCENTRIC ONLY. Units: DEGREES
Here's a noon analemma for Greenwich observatory, using a 7 day timestep, and a datestep of 4 (so every 4th dot is larger). This plot is for 2023. It doesn't use refraction.

The program can display numeric labels near the datestep points, but they tend to clutter the diagram, so I toggled the labels off for that example.
Here's the code.
""" Retrieve solar azimuth & elevation from Horizons for a specified Earth location
    and plot it in 3D on a globe.

    Written by PM 2Ring 2024.01.13
"""

import re, requests
from functools import lru_cache

url = "https://ssd.jpl.nasa.gov/api/horizons_file.api"
api_version = "1.0"

# Greenwich Lon, Lat, Alt (km)
greenwich = '0.0, 51.4773207, 0.06707'

base_cmd = """
MAKE_EPHEM=YES
EPHEM_TYPE=OBSERVER
QUANTITIES=4
CAL_FORMAT=CAL
CAL_TYPE=GREGORIAN
CSV_FORMAT=YES
OBJ_DATA=NO
COMMAND=10
"""

@lru_cache(maxsize=int(3))
def fetch_data(site, coord, start, stop, step, refracted, verbose=True):
    if site == "":
        site = "coord"
    apparent = "REFRACTED" if refracted else "AIRLESS"

    cmd = f"""
!$$SOF
{base_cmd}
CENTER='{site}@399'
SITE_COORD='{coord}'
START_TIME='{start}'
STOP_TIME='{stop}'
STEP_SIZE='{step}'
APPARENT='{apparent}'
!$$EOF
"""
    #print(cmd)
    req = requests.post(url, data={'format': 'text'}, files={'input': ('cmd', cmd)})
    version = re.search(r"API VERSION:\s*(\S*)", req.text).group(1)
    if version != api_version:
        print(f"Warning: API version is {version}, but this script is for {api_version}")

    m = re.search(r"(?s)\\\$\\\$SOE(.*)\\\$\\\$EOE", req.text)
    if m is None:
        print("NO EPHEMERIS")
        print(req.text)
        return None

    if verbose:
        print(req.text)
    else:
        lines = req.text.splitlines()
        print("\n".join(lines[5:19]), "\n")

    return m.group(1)[1:]

def extract_data(data, datestep):
    data = data.splitlines()
    data = [s.split(',')[:-1] for s in data]
    #for row in data: print(row)
    #return

    pos, dates = [], []
    for i, row in enumerate(data):
        # Extract azimuth & elevation
        az, el = float(row[3]), float(row[4])
        pos.append((az, el))

        # Make timestamps
        if datestep and i % datestep == 0:
            # Extract calendar date
            ymd, hms = row[0].split()
            dates.append(ymd)

    return pos, dates

# Globe with lat-lon grid
var('u,v')
pp = parametric_plot3d
deg = pi / 180
dth = 15 * deg

def xyz(lat, lon):
    r = cos(lat)
    return vector([r*cos(lon), r*sin(lon), sin(lat)])

udom, vdom = (u, -pi/2, pi/2), (v, -pi, pi)
G = pp(xyz(u, v), udom, vdom, color='#007', plot_points=75)
G += sum(pp(xyz(u, lon), udom, color='#00c' if lon != pi else '#0ac') for lon in srange(0, pi*2, dth))
G += sum(pp(xyz(lat, v), vdom, color='#00c' if lat else '#0ac') for lat in srange(dth-pi/2, pi/2, dth))

@interact
def main(txt=HtmlBox("<h3>Analemma globe</h3>"),
  site='', coord=('lon, lat, alt (km)', greenwich),
  start="2023-Jan-01 12:00", stop="2024-Jan-01", step="7d",
  datestep=4, show_labels=True, refracted=False, color="red",
  verbose=False, auto_update=False):

    result = fetch_data(site.strip(), coord.strip(),
      start.strip(), stop.strip(), step.strip(), refracted, verbose=verbose)
    if result is None:
        print("No ephemeris data found!")
        return

    pos, dates = extract_data(result, datestep)
    #for row in pos: print(row)

    for i, s in enumerate(dates):
        print(i, s)

    # Make a blank globe
    P = G

    for i, (az, el) in enumerate(pos):
        do_label = datestep and i % datestep == 0
        v = xyz(el * deg, -az * deg)
        P += point3d(v, size=5 if do_label else 3, color=color)
        if show_labels and do_label:
            label = str(i // datestep)
            vv = v * 1.1
            P += text3d(label, vv, fontsize=8)

    P.show(frame=False, theme='dark', projection='orthographic', online=True)
The data-fetching part of the code is plain Python. The Sage features are only needed to do the 3D display.
Here's a live version of the program, running on the SageMathCell server.
The program maintains a cache of its last 3 queries of Horizons data, so if you only change "cosmetic" options the plot is generated without re-fetching the data from Horizons.
Here are the 3D interface controls.
- Orbit - right mouse, or left mouse + ctrl/meta/shiftKey
- Zoom - middle mouse, or mousewheel
- touch: two-finger spread or squish
- Pan - left mouse, or arrow keys


