3
$\begingroup$

I am building some device as a gift for my girlfriend.

For this device to work, I need to be able to calculate the angle to which I should look towards (3D angle), in order to see the moon.

This angle is affected by (and maybe not only):

  • The time of year.

  • The hour.

  • The location on earth from which I look.

I'm sure there's some formula that approximates the angle.

I don't need an exact value, I can live with +-1 degree.

$\endgroup$
7
  • 3
    $\begingroup$ by "I need to calculate" do you mean 1) I want a pen and paper method. or 2) I want something that I can run in low-level code on an embedded device, or 3) I'm happy to use a python library to do this or 4) I'm happy with a running some planetarium software. $\endgroup$
    – James K
    Commented Sep 20, 2018 at 20:47
  • 1
    $\begingroup$ The moon's position varies +-1 degree based on your location on Earth. The moon's motion is also fairly complex, so I don't see a simple formula that would have any degree of accuracy. Also, you probably mean "angles" plural: azimuth and elevation. I suppose a solid angle (3D angle) would work, but it's more traditional to use two angles. Also, does your device have a compass so it know where north/south is? Does it have GPS? $\endgroup$
    – user21
    Commented Sep 20, 2018 at 22:47
  • $\begingroup$ @JamesK Something I could plug into an excell sheet would b best for me. The device has no software or engines, just a complex array of mirrors. I would like to be able to predict the moon's location before i actually build or place anything. $\endgroup$
    – Gulzar
    Commented Sep 20, 2018 at 23:41
  • $\begingroup$ @barrycarter Since what I'm building will be build noce and forever without being moved, you could assume an exact GPS location. and yes, I meant "angles". Isn't there some complex formula i can just plug into excell/python/whatever? $\endgroup$
    – Gulzar
    Commented Sep 20, 2018 at 23:43
  • 2
    $\begingroup$ Just to clarify, is your device being designed for one instant in time, or will it work for any date and time? The Astronomical Almanac gives the equations you need (I do not have it with me :-). There may be a dozen equations to calculate the Moons position (geocentric), a half dozen for its topocentric position, then a half dozen to get its azimuth and altitude. Some type of real time calculation would be required for a device that works for any date, any time. $\endgroup$
    – JohnHoltz
    Commented Sep 21, 2018 at 15:13

2 Answers 2

5
$\begingroup$

For a one-off calculation, the easiest solution would be to use planetarium software, such as stellarium.

For a programming solution, a python package such as pyephem is an efficient way to calculate the position of the moon at multiple times, in a way that can be imported into a spreadsheet.

The apparent motion of the moon is more complex than you might think. The moon moves about 15 degrees per hour due to the rotation of the Earth. But on top of this fairly simple motion is the Moon's actual orbit around the Earth, which is elliptical (and so this motion is not even, the moon moves faster when it is close to the Earth) and the position and inclination of the orbit is perturbed by the Sun. The perturbations are fairly regular, and can be calculated, but these effects (rotation of the earth, the orbit of the moon, the eccentricity of the orbit, perturbation of orbit) combine to make the actual calculation more complex than "a formula" that can fit easily in a spreadsheet, which is why a package like pyephem is recommended.

$\endgroup$
2
$\begingroup$

In this answer I mention a source where handy formula for approximate behavior of celestial objects can be found.

Astronomical Algorithms by Jean Meeus

I don't have a copy personally so I can't verify if there is exactly what you need can be found there or not, but this pdf of a small subset of pages from the fourth edition includes the table of contents, which includes:

30. Position of the moon....................... 147
31. Illuminated Fraction of the Moon’s Disk.... 155
32. Phases of the Moon......................... 159

so there's a good chance in those seven or eight pages for chapter 30 there may be just what you are looking for.

I think the "3D angles" you mention would be just altitude (or elevation angle) and azimuth. The first is the angle above (or below) the horizon, and the second is like the "compass direction" except starting at true north, not magnetic north, so it's just 2D.

If you are comfortable using Python, one of the easiest computer languages, there is a package called Skyfield. I believe you should be able to get it to run on a Raspberry Pi for example, if your creation is electromechanical. The package is very precise so it generally needs a connection to the internet to "check stuff" which is a little frustrating sometimes.

You could also calculate a table for your location, then save it and use it to run a small computer or controller, if you are using one.

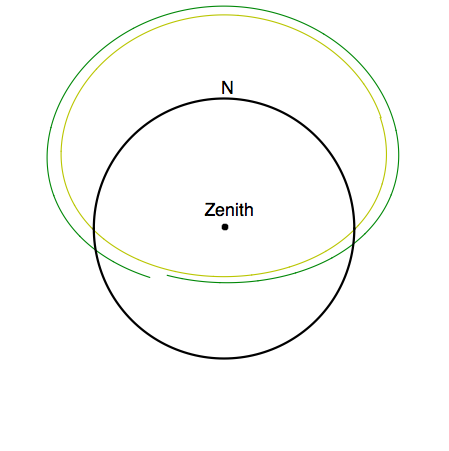
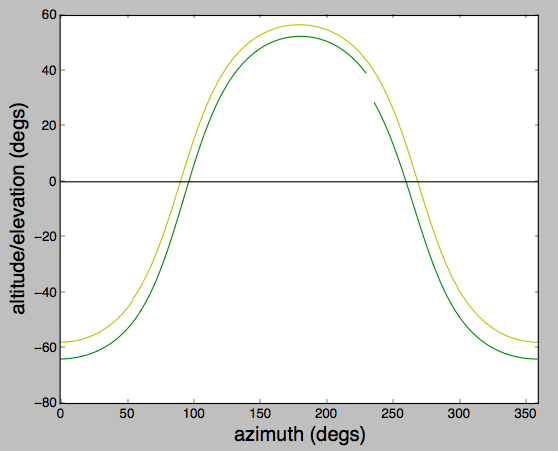
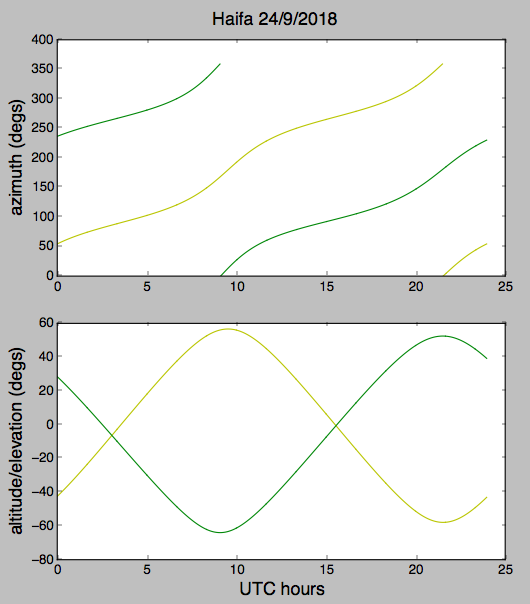
GREEN  = Moon (being made of green Cheese of course)
YELLOW = Sun
enter image description here

enter image description here

enter image description here

import numpy as np
import matplotlib.pyplot as plt
from skyfield.api import Loader, Topos

halfpi, pi, twopi = [f*np.pi for f in 0.5, 1, 2]
degs, rads        = 180/pi, pi/180

load   = Loader('~/Documents/fishing/SkyData')
data   = load('de421.bsp')
ts     = load.timescale()

de421  = load('de421.bsp')
earth  = de421['earth']
sun    = de421['sun']
moon   = de421['moon']

Haifa   = earth + Topos(32.82, 34.98)
minutes = np.arange(60*24)
times   = ts.utc(2018, 9, 24, 0, minutes)

salt, saz, sd = Haifa.at(times).observe(sun).apparent().altaz()
malt, maz, md = Haifa.at(times).observe(moon).apparent().altaz()

saltr, sazr, maltr, mazr = [x.radians for x in (salt, saz, malt, maz)]

sr, mr = [1. - x/halfpi for x in (saltr, maltr)]

sx, sy = [sr * f(sazr) for f in (np.sin, np.cos)]
mx, my = [mr * f(mazr) for f in (np.sin, np.cos)]

theta = np.linspace(0, twopi, 201)
xc, yc = [f(theta) for f in (np.cos, np.sin)]

if True:
    plt.figure()
    plt.plot(sx, sy, '-y')
    plt.plot(mx, my, '-g')
    plt.plot(xc, yc, '-k', linewidth=2)
    plt.plot([0], [0], 'ok')
    plt.xlim(-1.8, 1.8)
    plt.ylim(-1.8, 1.8)
    plt.text(-0.15, 0.1, 'Zenith', fontsize=16)
    plt.text(-0.02, 1.04, 'N', fontsize=16)
    #plt.text(-1.6, 1.0, 'North is up', fontsize=16)
    plt.show()


saltd, sazd, maltd, mazd = [x.degrees for x in (salt, saz, malt, maz)]
mbreaks = np.where(np.abs(mazd[1:]-mazd[:-1] < 0))
sbreaks = np.where(np.abs(sazd[1:]-sazd[:-1] < 0))

saltd, sazd, maltd, mazd = [x[:-1] for x in (saltd, sazd, maltd, mazd)]
sazd[sbreaks] = np.nan
mazd[mbreaks] = np.nan

if True:
    plt.figure()
    plt.plot(sazd, saltd, '-y')
    plt.plot(mazd, maltd, '-g')
    plt.plot([0, 360], [0, 0], '-k')
    plt.xlabel('azimuth (degs)', fontsize=18)
    plt.ylabel('altitude/elevation (degs)', fontsize=18)
    plt.xlim(0, 360)
    plt.show()

if True:
    plt.figure()
    hours = minutes[:-1]/60.

    plt.subplot(2, 1, 1)

    plt.plot(hours, sazd, '-y')
    plt.plot(hours, mazd, '-g')
    # plt.xlabel('UTC hours', fontsize=16)
    plt.ylabel('azimuth (degs)', fontsize=16)

    plt.subplot(2, 1, 2)

    plt.plot(hours, saltd, '-y')
    plt.plot(hours, maltd, '-g')
    plt.xlabel('UTC hours', fontsize=16)
    plt.ylabel('altitude/elevation (degs)', fontsize=16)

    plt.suptitle("Haifa 24/9/2018", fontsize=16)

    plt.show()
$\endgroup$

You must log in to answer this question.

Not the answer you're looking for? Browse other questions tagged .