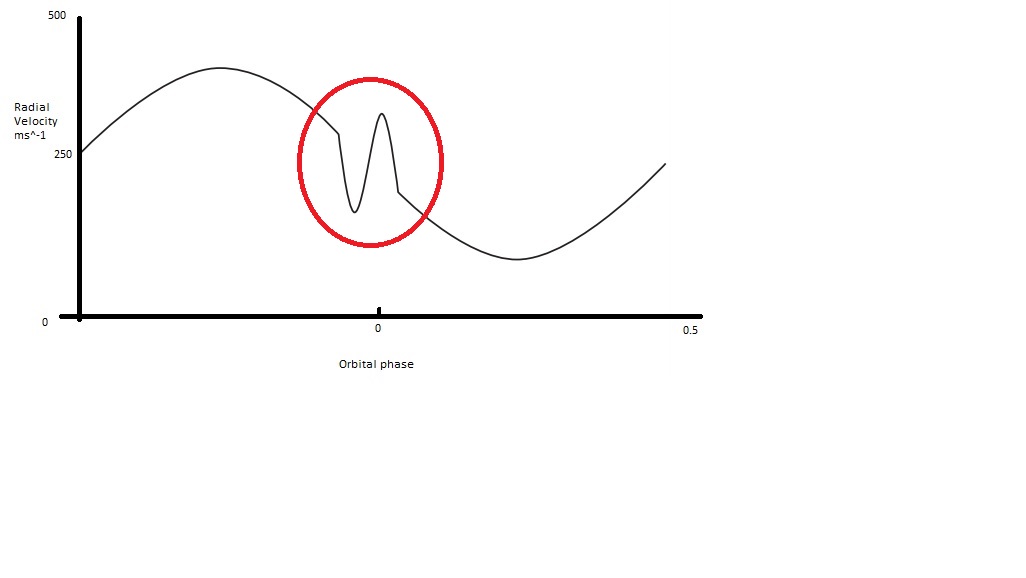
I am trying to understand the effect of the Rossiter–McLaughlin effect on radial velocity plots. Can someone help me and explain what exactly is happening in the red circle?
1 Answer
What's happening is that (i) the star is spinning and (ii) it is being eclipsed (by an exoplanet perhaps?)
As the exoplanet (or whatever dark object eclipses the star, the same explanation would apply to a brown dwarf or very low-mass companion) traverses across the face of the star it will eclipse parts of the stellar surface that gave their own specific line of sight velocity.
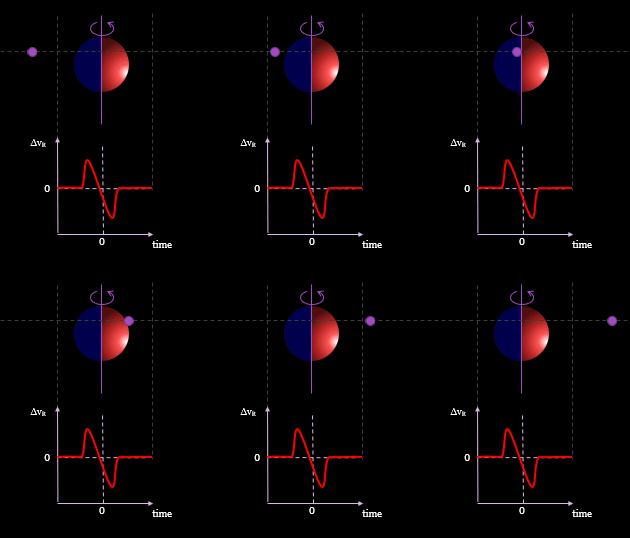
For example if we are seeing the system edge-on to the stellar equator and the planet orbits in prograde fashion with zero inclination, then it will first eclipse the side of the star that is spinning towards us. This takes a blue-shifted chunk out of the stellar spectrum, leading to a slight redshift (compared to what might have been expected). As the transit continues, the exoplanet moves across the centre of the star and then to a position blocking the redshifted side of the star, leading to a slight blueshift compared to what would be expected.
The image below (by AMitchell and shared under CC Attribution-Share Alike 4.0 International shows this situation.
Your plot shows this happening the other way around: a blueshift followed by a redshift. This can be explained if the exoplanet orbits in retrograde fashion, so it obscures redshifted, followed by blue-shifted stellar light.
-
$\begingroup$ Thank you ProfRob, thats a great help. $\endgroup$– banyansCommented Jan 24, 2021 at 21:11

