Answers to Latitude, longitude and altitude of Ckoirama Observatory; where can things like this be looked-up? point to https://www.minorplanetcenter.net/iau/lists/ObsCodesF.html which currently lists 2198 observatories.
The first character of the three character codes has 36 possible alphanumeric values. and the second two are only digits. That allows for 36*10*10 = 3600 possible codes.
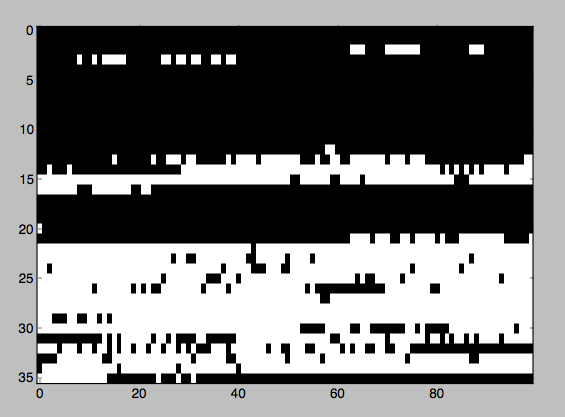
I plotted the ones that are currently used and the pattern is interesting. Why are some letter codes fully used (all 100 two digit suffixes are populated) whereas others are completely empty? I haven't noticed an alphabetical associations.
Y = 0 to 9 are the digits and 10 to 36 are A through Z: Shading means the code is used.
For some reason I can't stop comparing the data to the famous Arecibo message, a tiny 1-bit bitmapped image beamed to space containing DNA, amino acids, our solar system and other goodies:
import numpy as np
import matplotlib.pyplot as plt
# blob is the unformatted lines from https://www.minorplanetcenter.net/iau/lists/ObsCodes.html
threes = [line[:3] for line in blob.splitlines()]
key = '0123456789ABCDEFGHIJKLMNOPQRSTUVWXYZ'
a = [[x] for x in key]
for t in threes:
    a[key.find(t[0])].append(t)
b = np.zeros((36, 100))
for i, thing in enumerate(a):
    c = [int(x[1:]) for x in thing[1:]]
    for d in c:
        b[i, d] = 1
plt.imshow(-b, interpolation='nearest', cmap='gray')
plt.gca().set_aspect(2)
plt.show()
pairs = []
todegs = 180/np.pi
for line in blob.splitlines():
    try:
        cos, sin = [float(x) for x in (line[13:21], line[21:30])]
        lat = todegs * np.arctan2(sin, cos)
        lon = float(line[4:13])
        pairs.append([lon, lat])
    except:
        pass
print(len(pairs), len(blob.splitlines()), float(len(pairs))/len(blob.splitlines()) )
lon, lat = np.array(list(zip(*pairs)))
lon = np.mod(lon+180, 360) - 180
plt.figure()
plt.plot(lon, lat, 'ok', markersize=1)
plt.ylim(-90, 90)
plt.xlim(-180, 180)
plt.gca().set_aspect('equal')
plt.show()

