In years, what is the time it takes our sun to orbit around our solar system's barycenter?
1 Answer
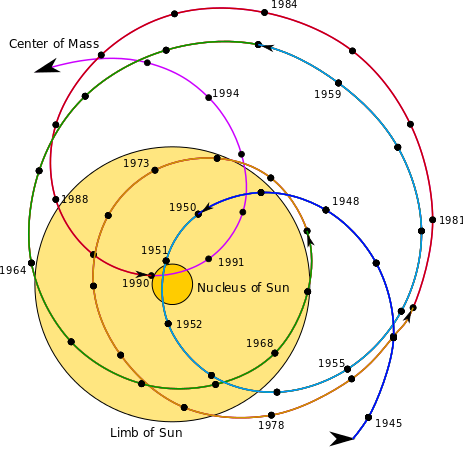
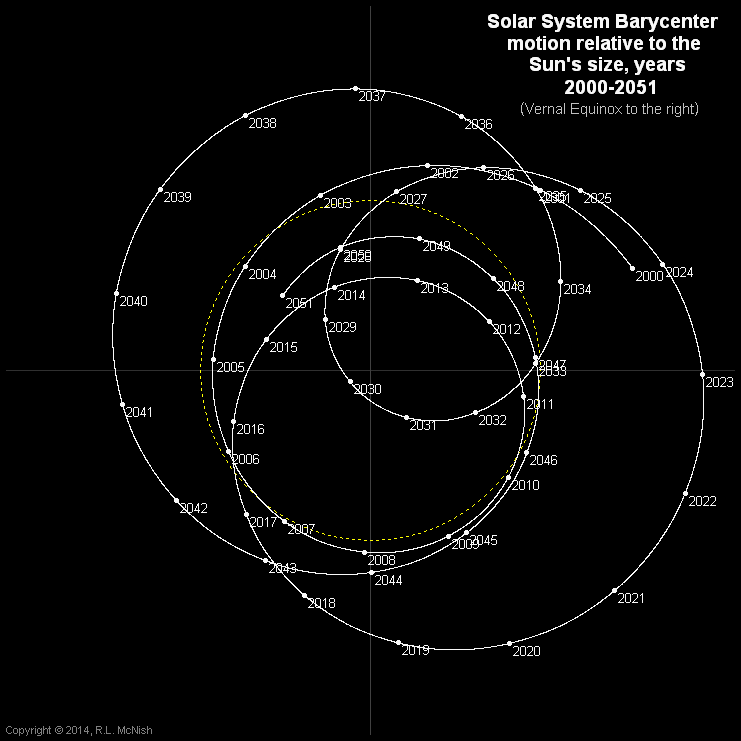
As you can see from the diagrams below of the motion of the Solar System's barycenter relative to the Sun (courtesy of Wikipedia), the Sun's motion with respect to the system's barycenter is not a simple closed curve, and it doesn't have a simple period.
(Click the above image for a SVG version).
It is primarily dominated by Jupiter's period (11.862 years) because Jupiter has most of the non-solar mass of the Solar System. (On a related note, Jupiter has most of the angular momentum of the solar system). Jupiter's mass is approximately 0.0009543 solar masses, so the Sun is almost 1048 times more massive than Jupiter.
According to Wikipedia
To calculate the actual motion of the Sun, you only need to consider the motions of the four giant planets (Jupiter, Saturn, Uranus, Neptune). The contributions of all other planets, dwarf planets, etc. are negligible.
Here is a Sage / Python script which displays an interactive 3D plot of the above diagrams, using data from the JPL Horizons on-line solar system data and ephemeris computation service. Horizons can produce data covering a wide range of dates, please see the Horizons documentation for details.
FWIW, here's a plot of the Sun's speed relative to the barycentre.
-
-
2$\begingroup$ @sunSis It varies quite a bit, but it's roughly 12 years. $\endgroup$– PM 2RingCommented Oct 16, 2018 at 1:16
-
9$\begingroup$ @SunSis - The correct answer is in this answer: "the Sun's motion with respect to the system's barycenter is not a simple closed curve, and it doesn't have a simple period." By insisting on a simple period, you are demanding an answer that doesn't exist. $\endgroup$ Commented Oct 16, 2018 at 10:30
-
-
1$\begingroup$ @DaddyKropotkin I'm not calculating the data, I'm pulling it directly from the JPL Development Ephemeris via their Horizons interface. I'm using that 3D position & velocity data (of the Sun, relative to the Solar System barycentre) to calculate the Bezier control points, which Sage then uses to plot the curves. Although the curves are in 3D, at this scale it's not easy to see that the curves aren't perfectly planar. The Z coordinate variation is ~1% of the X & Y variation. $\endgroup$– PM 2RingCommented May 3, 2021 at 19:56


