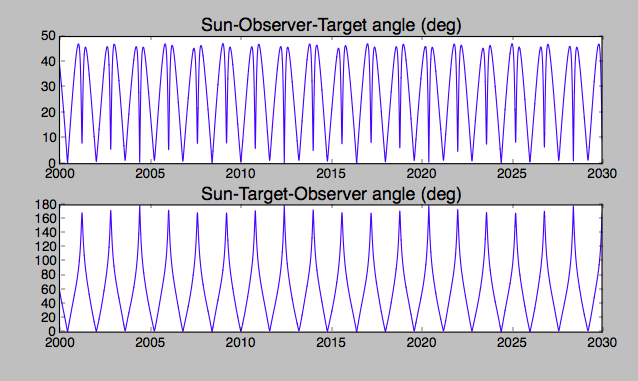
As the phase angle of Venus changes, so does its distance to Earth. More about modeling the phase angle dependence of apparent magnitude can be found in this answer to Calculating the apparent magnitude of a satellite. For more on that subject, see What is the difference between albedo, absolute magnitude or apparent magnitude? and also these: 1, 2, 3.
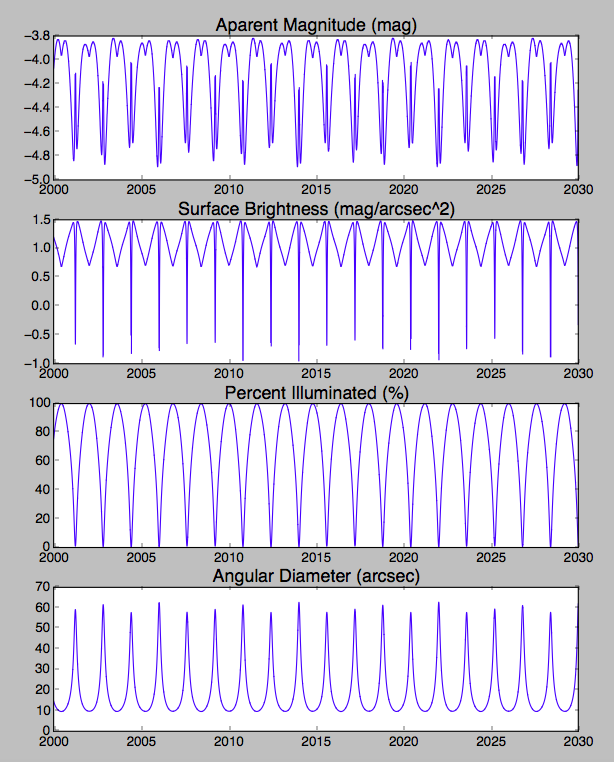
When it is closest to us, the smallest fraction of the disk is illuminated, and when it's farthest, nearly the whole disk is illuminated. This cancellation results in a compression of the range of apparent magnitudes throughout the Earth-Venus synodic cycle.
Remarkably, Venus' apparent brightness stays within roughly a 1.2 magnitude range throughout its synodic cycle!
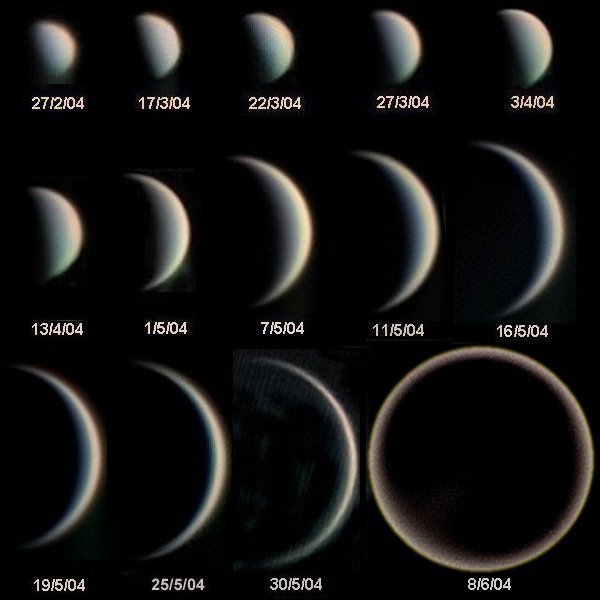
I've dropped out a few data points where apparent magnitude was reported as n.a. but those likely represent geometries where they have less confidence on the model. Looking at the images of Venus below you can see that close to inferior conjunction the light from Venus is strongly forward-scattered and so details of the atmospheric optical properties will strongly affect the apparent brightness.
The image below is from the question How (the heck) was this photo of Venus at inferior conjunction (between us and the Sun) taken?

above: Phases of Venus, from here.
Below I've used predictions from JPL's Horizons web interface using the setup below.


Python script for plotting:
import numpy as np
import matplotlib.pyplot as plt

fname = 'horizons_results Venus magnitude 01.txt'

with open(fname, 'r') as infile:
    lines = infile.readlines()

lines = lines[0].splitlines()

iSOE  = [i for i, line in enumerate(lines) if "$$SOE" in line][0]
iEOE  = [i for i, line in enumerate(lines) if "$$EOE" in line][0]

lines = lines[iSOE+1:iEOE]
lines = [line.replace('n.a.', '-42') for line in lines]

years = 2000 + np.arange(len(lines))/365.2564

lines = [line.split()[2:] for line in lines]
[x.pop(9) for x in lines]
lines = [[float(x) for x in line] for line in lines]

data = (np.array(lines).T).copy()
data[data==-42.] = np.nan

aparent_magnitude, surface_brightness, illum_percent, angular_diam = data[0:4]
d_Earth, dd_Earth, d_Sun, dd_Sun = data[4:8]
Sun_Oberver_Target, Sun_Target_Observer = data[8:10]

if True:
    plt.figure()
    names  = ('Aparent Magnitude (mag)', 'Surface Brightness (mag/arcsec^2)',
              'Percent Illuminated (%)', 'Angular Diameter (arcsec)')
    things = (aparent_magnitude, surface_brightness,
              illum_percent, angular_diam)
    for i, (name, thing) in enumerate(zip(names, things)):
        plt.subplot(4, 1, i+1)
        plt.plot(years, thing)
        plt.title(name, fontsize=16)
        plt.xlim(2000, 2030)
    plt.show()

if True:
    plt.figure()
    names  = ('Sun-Observer-Target angle (deg)',
              'Sun-Target-Observer angle (deg)'  )
    things = (Sun_Oberver_Target, Sun_Target_Observer)
    for i, (name, thing) in enumerate(zip(names, things)):
        plt.subplot(4, 1, i+1)
        plt.plot(years, thing)
        plt.title(name, fontsize=16)
        plt.xlim(2000, 2030)
    plt.show()


